


A trace viewer designed around tests, part of Playwright OpenTelemetry. A hosted copy runs at trace.endform.dev.
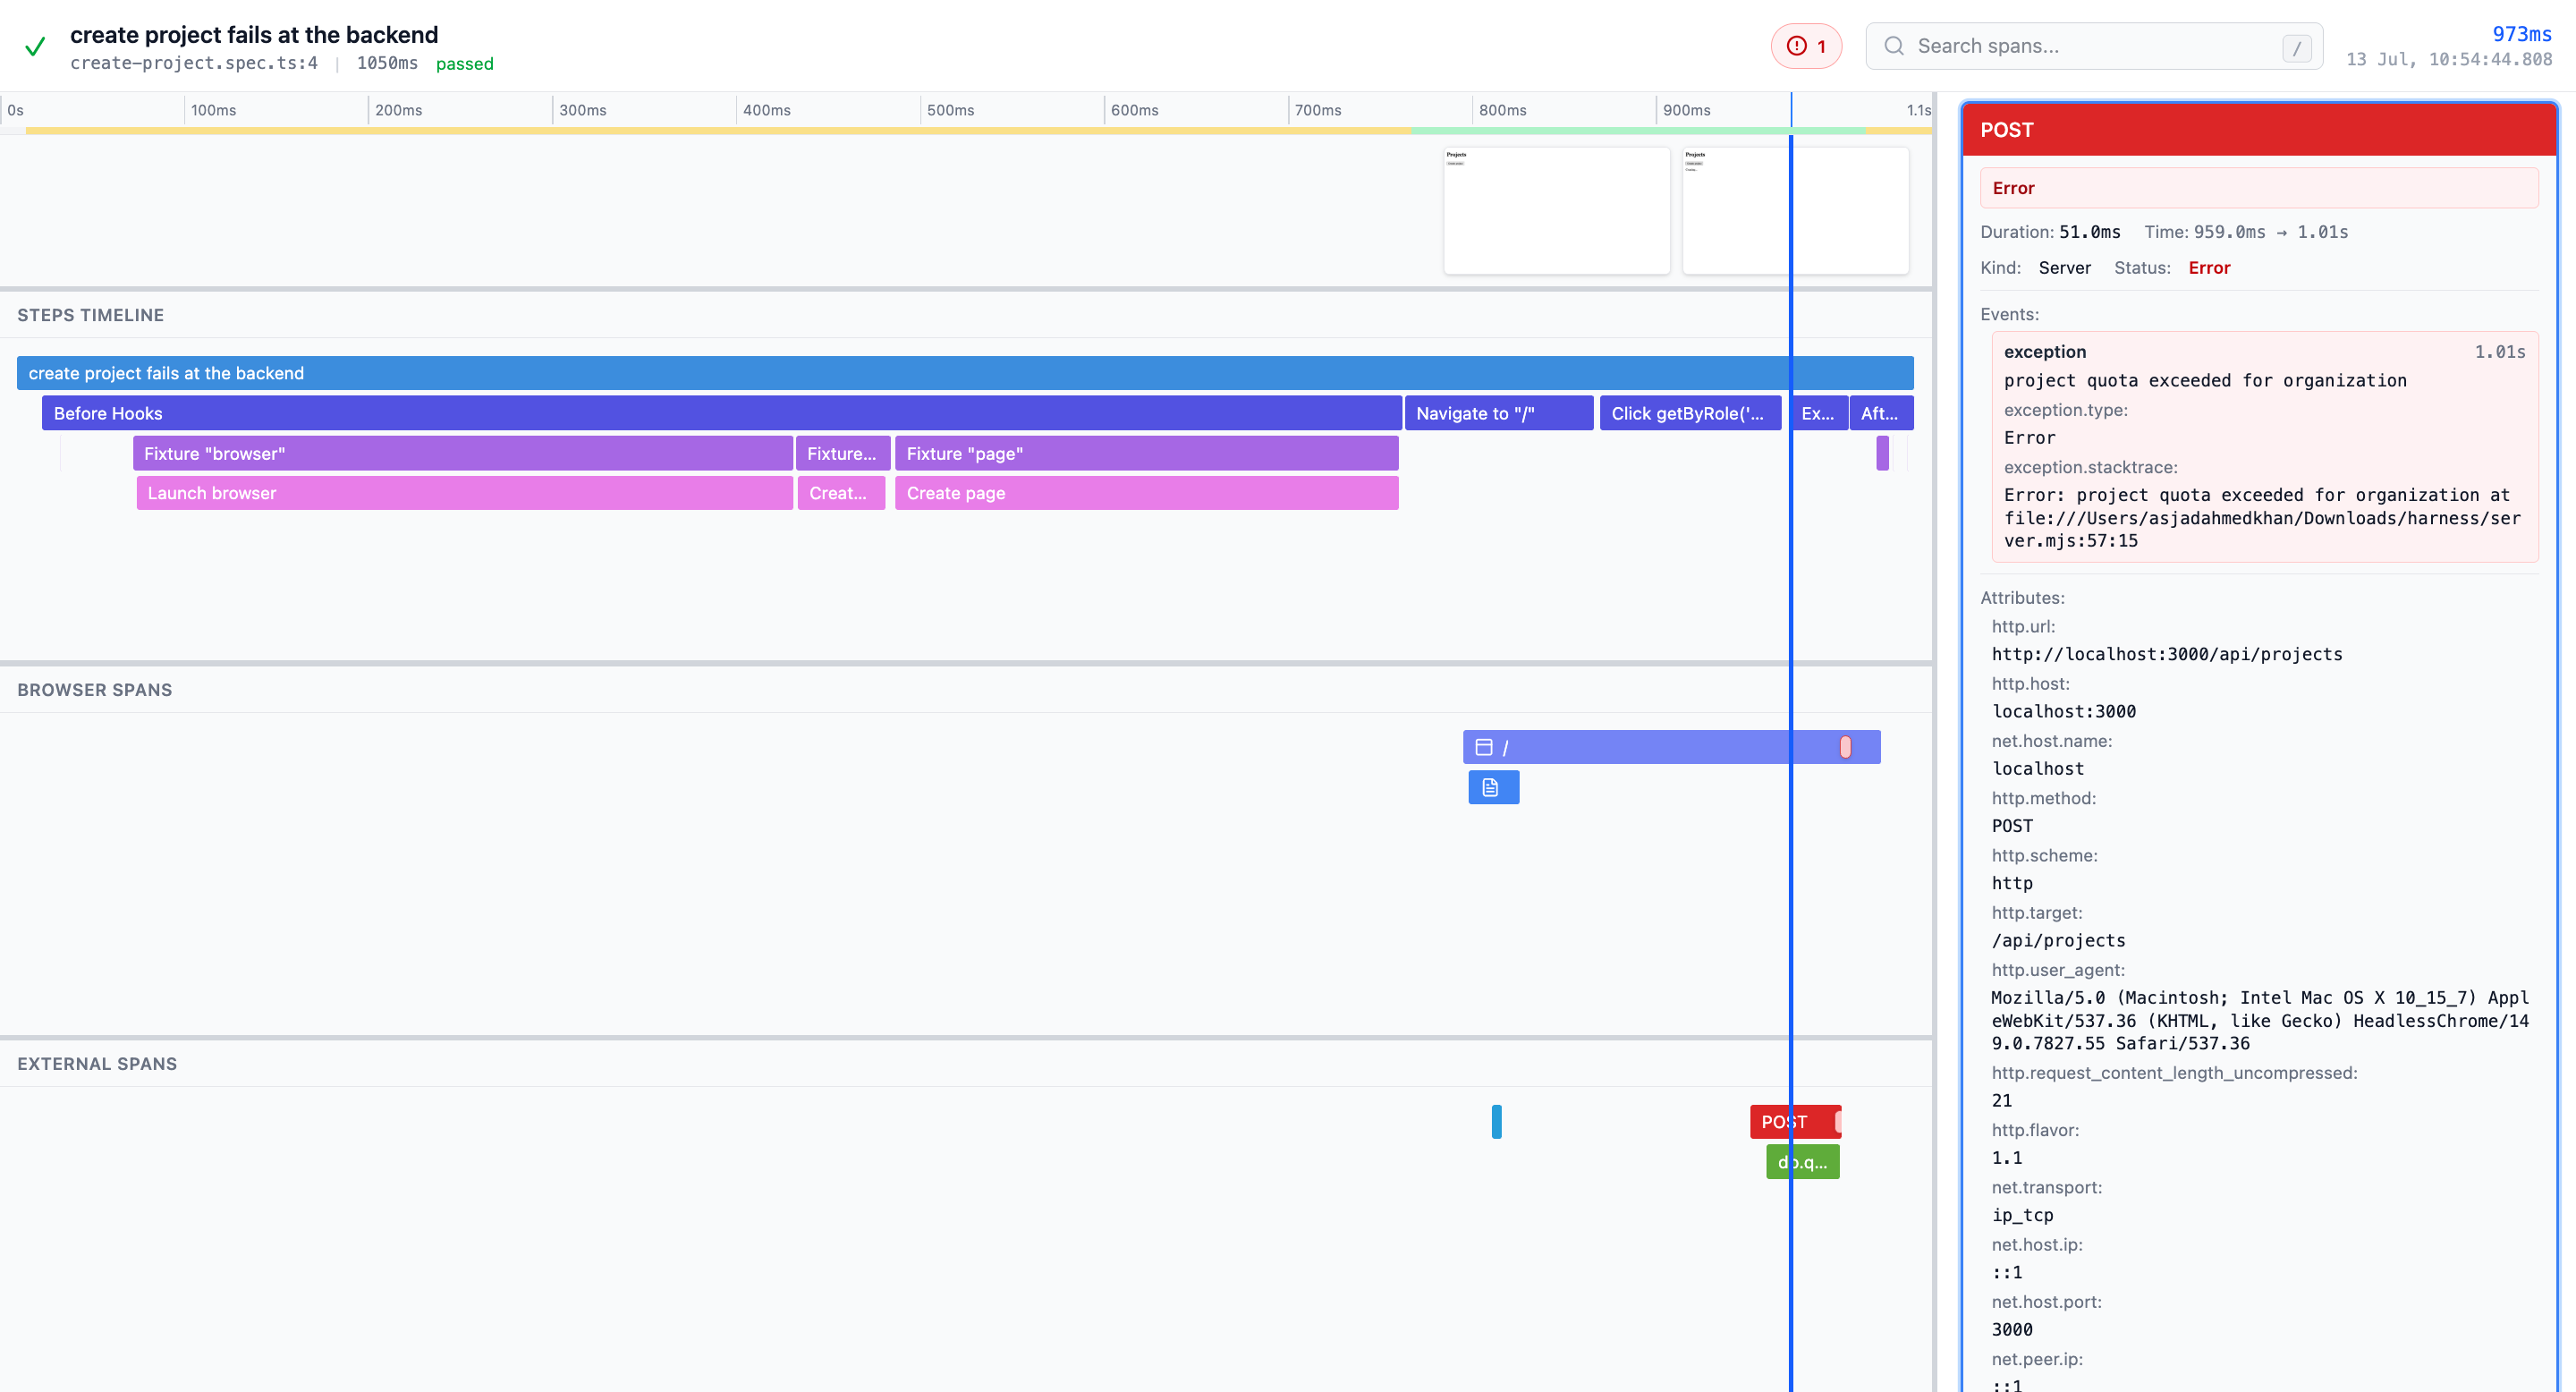
The viewer reads OpenTelemetry trace data directly rather than a proprietary test-result format. The layout plays the test back above a time-aligned flame graph: a large screenshot of the page (or, chosen in the settings menu, a filmstrip with a row of frames per page), a control bar to step through the test or play it, and a step ruler that scrubs through the whole test and shows a screenshot filmstrip as you hover it. The flame graph below is separated into three views that match how you investigate a failure:
- Test steps for the Playwright test, hooks, fixtures, and actions
- Browser spans for navigation, routes, JavaScript, fonts, images, fetches, and other requests
- External spans for your instrumented application and backend services
Console messages and uncaught browser errors appear as span events on the timeline. You can search span names and attributes, inspect span details and events, jump between errors, and zoom into a time range, while the screenshots stay synchronized with the timeline and grouped by browser context and page.
To boot the trace viewer on localhost:9294:
npx @playwright-opentelemetry/trace-viewerThe viewer can load a local trace zip or a trace-specific API base URL such as /playwright-otel-trace-viewer/v1/{traceId}. Remote API loading fetches {baseUrl}/traces once for the merged OTLP export, derives test metadata from the root playwright.test span, then downloads {baseUrl}/screenshots.zip when screenshots are needed.
If the viewer URL includes traceToken, the token is propagated to remote Trace API requests as a query parameter:
https://trace.endform.dev/?traceSource=https%3A%2F%2Fexample.com%2Fplaywright-otel-trace-viewer%2Fv1%2F{traceId}&traceToken={token}
This loads {baseUrl}/traces?traceToken={token} and {baseUrl}/screenshots.zip?traceToken={token}.
The token can also be embedded in the traceSource URL, or in a Trace API URL entered in the load form. The viewer normalizes those forms back to the canonical top-level traceToken query parameter.
The remote API contract is:
GET {baseUrl}/tracesreturns{ "resourceSpans": [...] },404when the trace does not exist, or401when the viewer isn't allowed to read itGET {baseUrl}/screenshots.zipreturns a ZIP with rootmanifest.jsonandscreenshots/*, or404when there are no screenshots
A 401 can say why with a code in its JSON body, and the viewer then shows a page explaining the problem instead of the load form. The codes are token_expired, token_invalid and token_missing. With token_expired, add expiredAt as an ISO 8601 time to show when:
{ "code": "token_expired", "expiredAt": "2026-11-06T11:53:00.000Z" }Any other response shows the generic error above the load form.
The service worker loads the ZIP and exposes internal per-screenshot URLs to the viewer. Where no service worker can run, the page downloads and unpacks the ZIP itself.
To show only some regions of the viewer, for example when embedding it in an iframe, add a view query parameter with a preset:
https://trace.endform.dev/?traceSource=...&view=player
| View | Panels |
|---|---|
full |
Every panel |
player |
viewer, ruler |
spans |
Every panel except viewer |
For full control, list the panels yourself with a comma-separated panels query parameter. It overrides view:
https://trace.endform.dev/?traceSource=...&panels=viewer,ruler,steps
| Panel | Region |
|---|---|
header |
Top bar with the test name, status, error spans, search, viewer settings, and time readout |
ruler |
Step ruler: the whole test with its steps and hooks, with a screenshot filmstrip on hover |
viewer |
Step viewer: the big screen or filmstrip, with a bar of step, playback and page controls |
steps |
Test steps timeline |
browser |
Browser spans timeline |
external |
External spans timeline |
details |
Span details sidebar |
When embedding the viewer in an iframe, add an action query parameter to put a button at the end of the player's control bar. For now the only action is expand:
https://trace.endform.dev/?traceSource=...&view=player&action=expand
The viewer doesn't run the action itself. Clicking the button posts { type: "trace-viewer:action", action: "expand" } to the embedding page, which decides what to do, for example open a modal holding the same trace in the full view. The button doesn't show when the viewer isn't in an iframe.
The message can be sent to any origin, so check who sent it:
window.addEventListener("message", (event) => {
	if (event.source !== iframe.contentWindow) return;
	if (event.origin !== "https://trace.endform.dev") return;
	if (event.data?.type !== "trace-viewer:action") return;
	if (event.data.action === "expand") openExpandedTrace();
});
Without view or panels, the viewer settings saved in the browser decide what is shown. With them, the URL decides instead: saved settings are ignored for that page, and changes made in the settings menu there are not saved. Unknown panel names are ignored. A panels list with no known names falls back to view, and an unknown view falls back to the saved settings. A listed panel is still hidden when the trace has no data for it. Sections with no data are disabled in the settings menu.
Remote API traces work inside <iframe sandbox="allow-scripts allow-forms">, which gives the viewer an opaque origin (null) and no service worker. The viewer detects this and needs no configuration, but two things have to be readable from origin null:
- The viewer's assets. Served with
Access-Control-Allow-Origin: *on/assets/*by default on Cloudflare (throughpublic/_headers) and bynpx @playwright-opentelemetry/trace-viewer. On any other host, including a custom base path behind a proxy, add that header yourself. Without it the sandboxed page stays blank. - The Trace API. Set
corsOrigin: "*"and pass atraceToken, because a sandboxed frame can't send cookies this way. The viewer only forwards the token: validate it in your Trace API, which doesn't check it for you.
Local and remote trace ZIPs still need a service worker, so they can't be loaded there.
Messages from an action arrive with the origin "null", so the event.origin check in that section rejects them. Any sandboxed page has that origin too, so don't allow "null" instead. Check which frame sent the message:
window.addEventListener("message", (event) => {
	if (event.source !== iframe.contentWindow) return;
	if (event.data?.type !== "trace-viewer:action") return;
	if (event.data.action === "expand") openExpandedTrace();
});You can deploy a copy of the trace viewer to Cloudflare:
git clone https://github.com/endformdev/playwright-opentelemetry.git
cd playwright-opentelemetry/trace-viewer

pnpm install
pnpm build
pnpm deployIf you want to build with absolute paths for a specific deployment location:
VITE_TRACE_VIEWER_BASE=/trace-viewer/ pnpm buildpnpm install
pnpm dev