We currently have the undesirable property that long(ish) labels can get cut off.
For example:
library(tinyplot)

mod = lm(body_mass ~ 0 + species, data = penguins)
coefs = data.frame(
  names(coef(mod)),
  coef(mod),
  confint(mod)
) |> setNames(c("term", "estimate", "lwr", "upr"))

plt(
  estimate ~ term,
  ymin = lwr, ymax = upr,
  data = coefs,
  type = "errorbar",
  theme = "clean"
)
box("outer", lty = 2)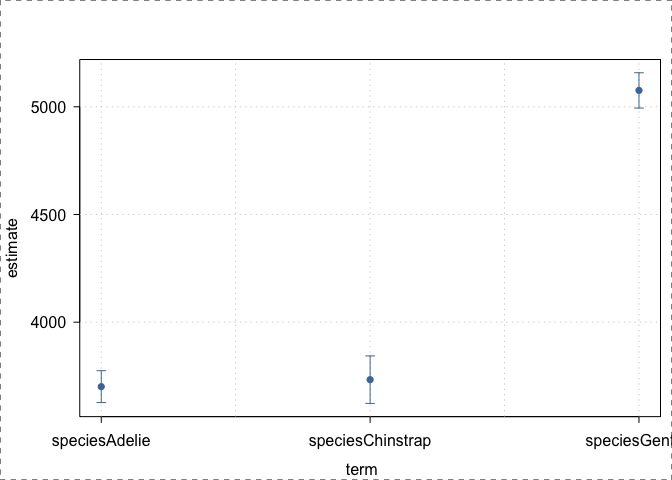
Created on 2025-09-21 with reprex v2.1.1
Somewhat related to #479
We currently have the undesirable property that long(ish) labels can get cut off.
For example:
Created on 2025-09-21 with reprex v2.1.1
Somewhat related to #479