Generate execution flow diagram #5924

Replies: 7 comments 11 replies

|
@markerikson how much of this would be solved by showing a call tree and user timings? curious what use cases would not be captured... |

|
Also - i know that a lot of user timings are dev only, but we can do a lot of this similar stuff at the framework level after the fact |

|
A call tree is probably one valid way to visualize this kind of info. I'm also sorta picturing (waves hands wildly) something more diagram-y, possibly with embedded snippets of code kinda like we have in comments. |

|
From @kettanaito in Reactiflux, asking separately without knowing about Replay :
|

|
I was excited to find out Replay can do something similar to what I'm looking for. My work is focused on creating tools that work in harmony with other tools. For that, I often inspect how things work. Being able to achieve a tangible execution trace would be awesome. |
|
Some more ideas and feedback, including suggesting using a "flame graph" diagram for navigating the execution of a replay: |
|
The https://domiii.github.io/dbux/acg Pasting some screenshots:
Those look basically like what I had in my head |


|
hi, this is Domi, creator of Dbux. Let me quickly introduce Dbux's "maps", i.e. global runtime visualization tools: (But I definitely also recommend checking out the much more complete (and generously timestamped) intro video.)
Some realizations after starting to use these tools
Implementation + Performance notes
Some more pretty pictures and stuffDbux (recent) Intro VideoFibonacci Call Graph vs. Call Stack (w/
|
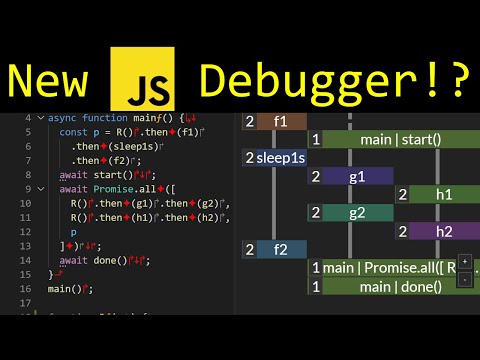
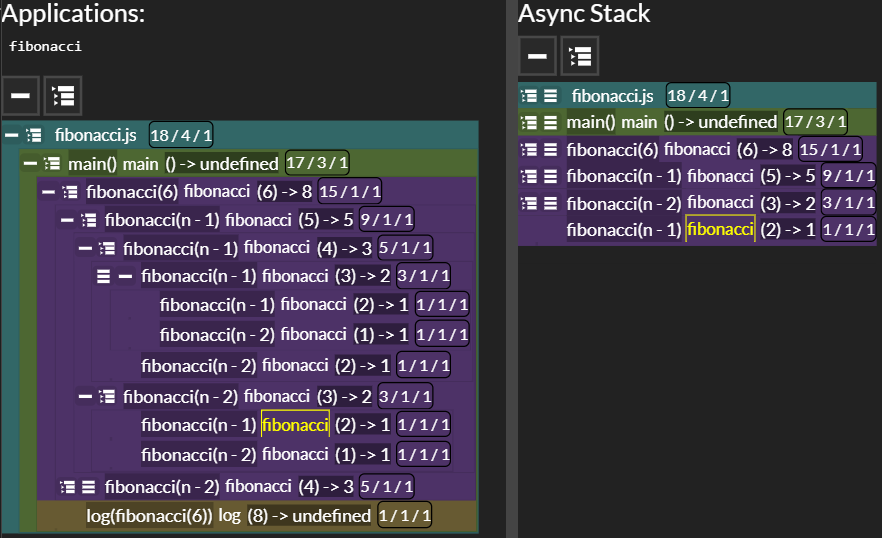
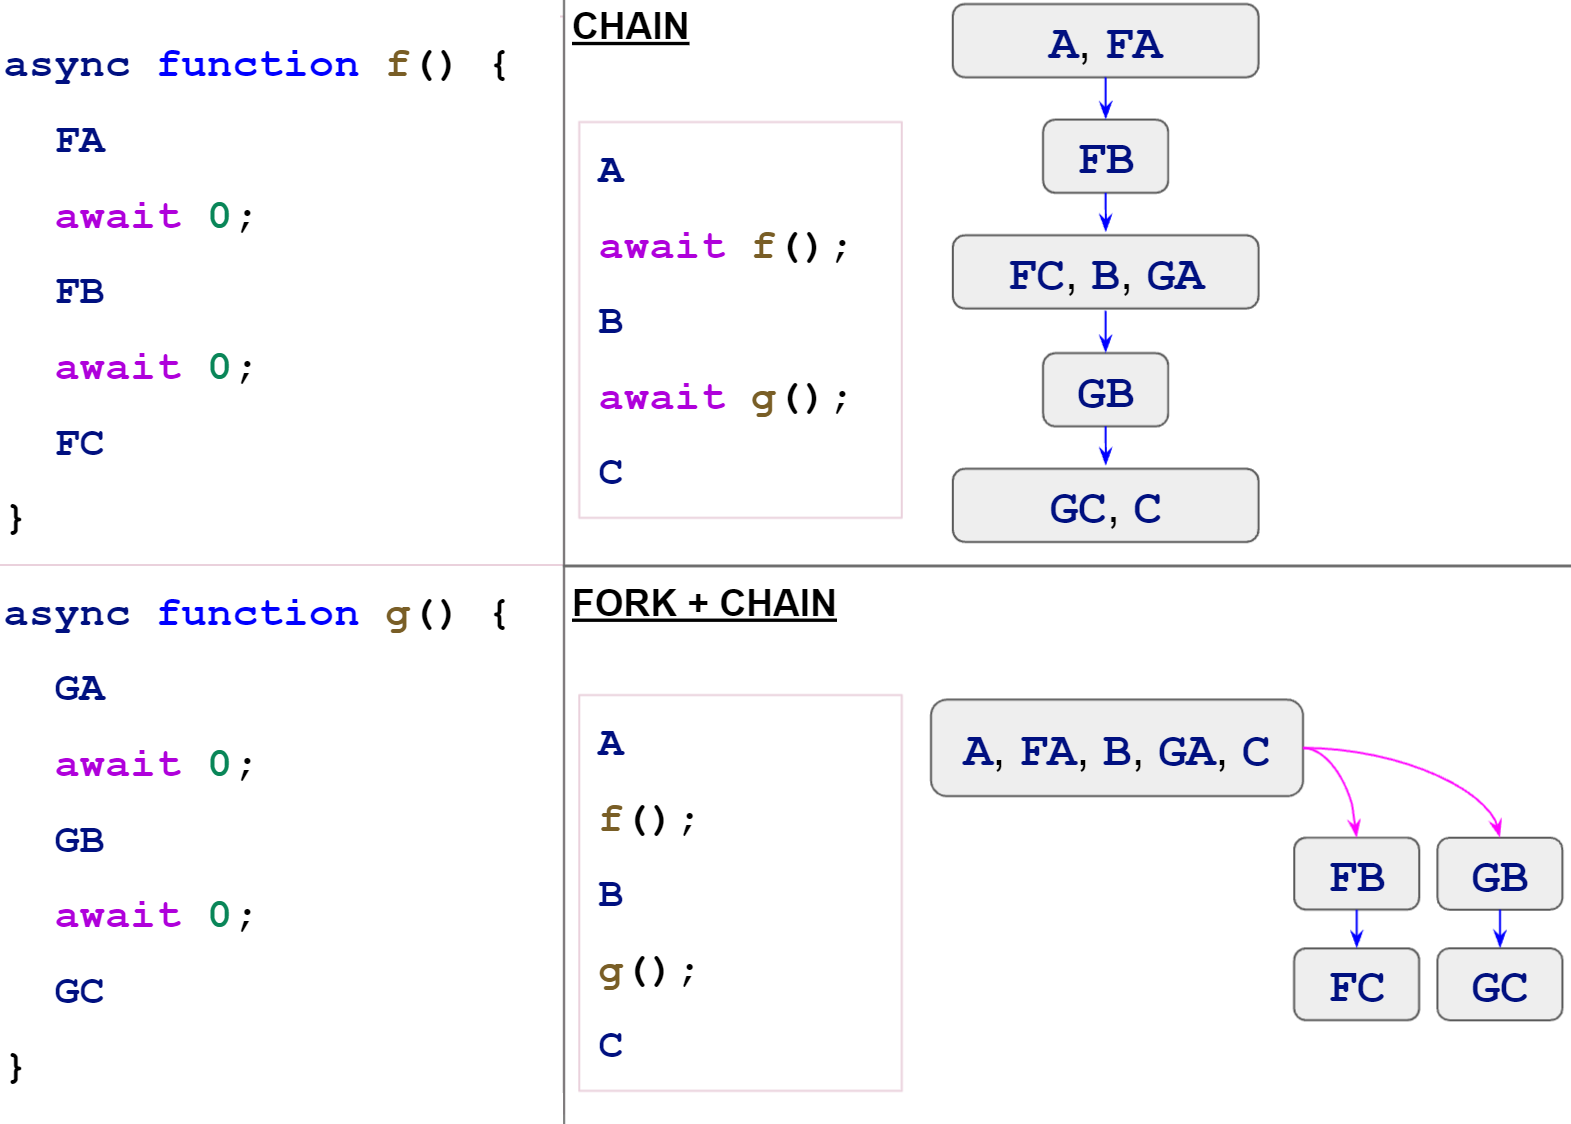


|
YES YES YES! This is ABSOLUTELY the kind of visualization I want to see in Replay! |
|
Another set of interesting diagrams: Kolo for Django:
|


|
Reminds me of the "circular bundle view" from I guess, the If I'm not mistunderstanding them, the |

|
Some more prior art: https://github.com/janestreet/magic-trace
|

|
Not to be a negative Nancy, but is this different from Browser Dev Tools' profiler's flamecharts or icycle plots? |
|
I personally always prefer putting the time dimension on "control flow maps" on the vertical dimension (and of course only if there are two clear dimensions to begin with), if the goal is readability and comprehension (rather than, in case of profilers: highlighting of bottlenecks). Generally speaking: if the goal is "highlighting of patterns", of course more discussions are to be had, but generally, I would avoid trying to stack text horizontally. |
|
Throwing something else in here: This extremely long article on perf profiling the guts of the Rust compiler talks about OpenTelemetry, and how to generate "spans" that can be visualized. Maybe something related we could do? https://fasterthanli.me/articles/when-rustc-explodes
|

|
Is the goal to aid profiling or program comprehension? |
|
Comprehension, mostly. If there's a crash with an error, I'd like to be able to see not just "the stack trace at the time of the error", but also "what functions and logic did we execute leading up to this spot". For example, when I was debugging https://app.replay.io/recording/logpoint-02js--2d7e7544-33f3-4e39-b82d-b4f7d0b2daf5?point=22067261651551680457036465793139134&time=10896.647887323943&hasFrames=true# yesterday, I had to do a bunch of back-tracing to go from the final test failure to figure out where things actually went wrong long before that. Having this sort of a trace diagram might have made that faster. |
|
It looks like a normal, vertically arranged call graph but a bit coarser, focusing only on processes and system interactions? |


Uh oh!
There was an error while loading. Please reload this page.
We're recording the entire app. Can we generate an execution flow diagram from that info?
I'd love to be able to see, say, a trace of the startup sequence for Replay itself:
Like, give me a way to visualize what files I'm jumping through, including the ability to blackbox things like React so we skip that stuff. Some potential visualizations:
dotvizgraphAll reactions