
HackBio Internship is a virtually regimented 5-week research internship that is practice oriented and focused on equipping scientists around the world with advanced bioinformatics and computational biology skills. Our team consists of 12 budding researches eager to get a hands-on training on drug development and we present you our work.
To know more about HackBio



👥 Contributors
| Slack User_Name | Contribution |
|---|---|
| @Madhu (leader) | Getting data and separating protein and ligands, Scatter plot (post-processing) |
| @Jay | Creating CHEMBL compound library |
| @Hellrider | Prepare files for docking |
| @StephanieEzzy | Docking |
| @GeePee | Visualisation of compound library |
| @WumiAO | Molecular fingerprints |
| @kheira | Molecular fingerprints |
| @Kerishnee | Clustering |
| @Tifee_ | Post-processing |
| @karthika | Post-processing |
| @Rita | Visualisation of docking |
| @Hammed | Visualisation of docking |
◾ Introduction
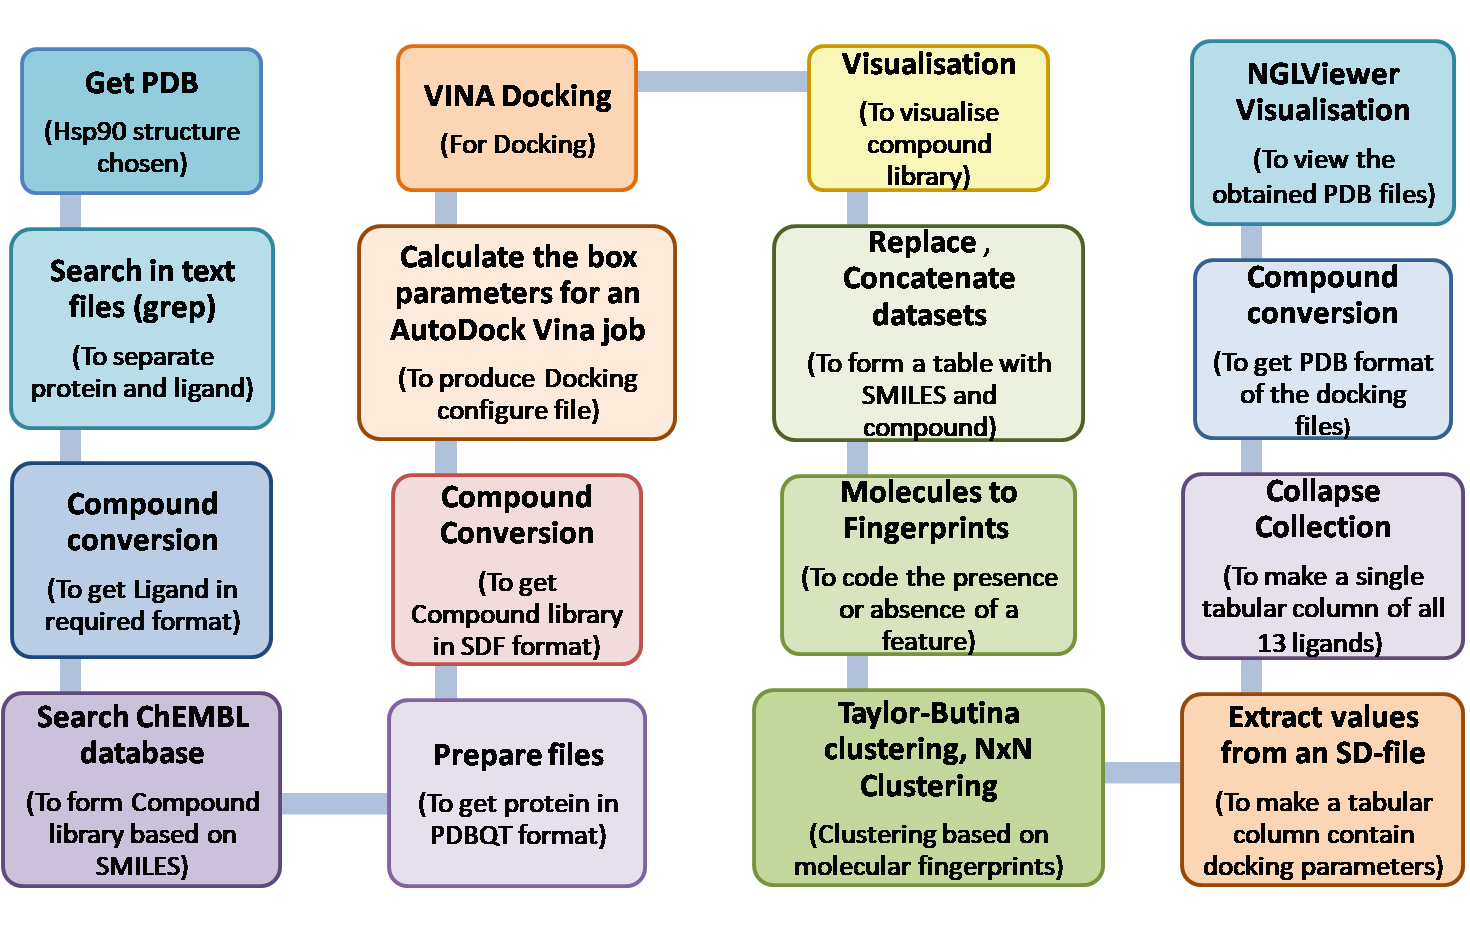
◾ Workflow
◾ Getting started with Galaxy
◾ Get Data
◾ Separate protein and ligand
◾ Create compound library
◾ Prepare files for Docking
◾ Docking
◾ Visualisation of Compound library
◾ Calculate Molecular fingerprints
◾ Clustering
◾ Post-processing
◾ Visualtion of docking
◾ Tutorial Reference
◾ Link for our work
◾ Acknowledgement
Computer Aided Drug Design focuses on development of potential compounds against a target based on several biological and physicochemical properties. This project is centered around protein-ligand docking, a molecular modelling technique. The goal of protein–ligand docking is to predict the position and orientation of a ligand when it is bound to a protein receptor or enzyme. It is similar to finding the best key (🔑) to a lock (🔒) when you have a bag full of keys.
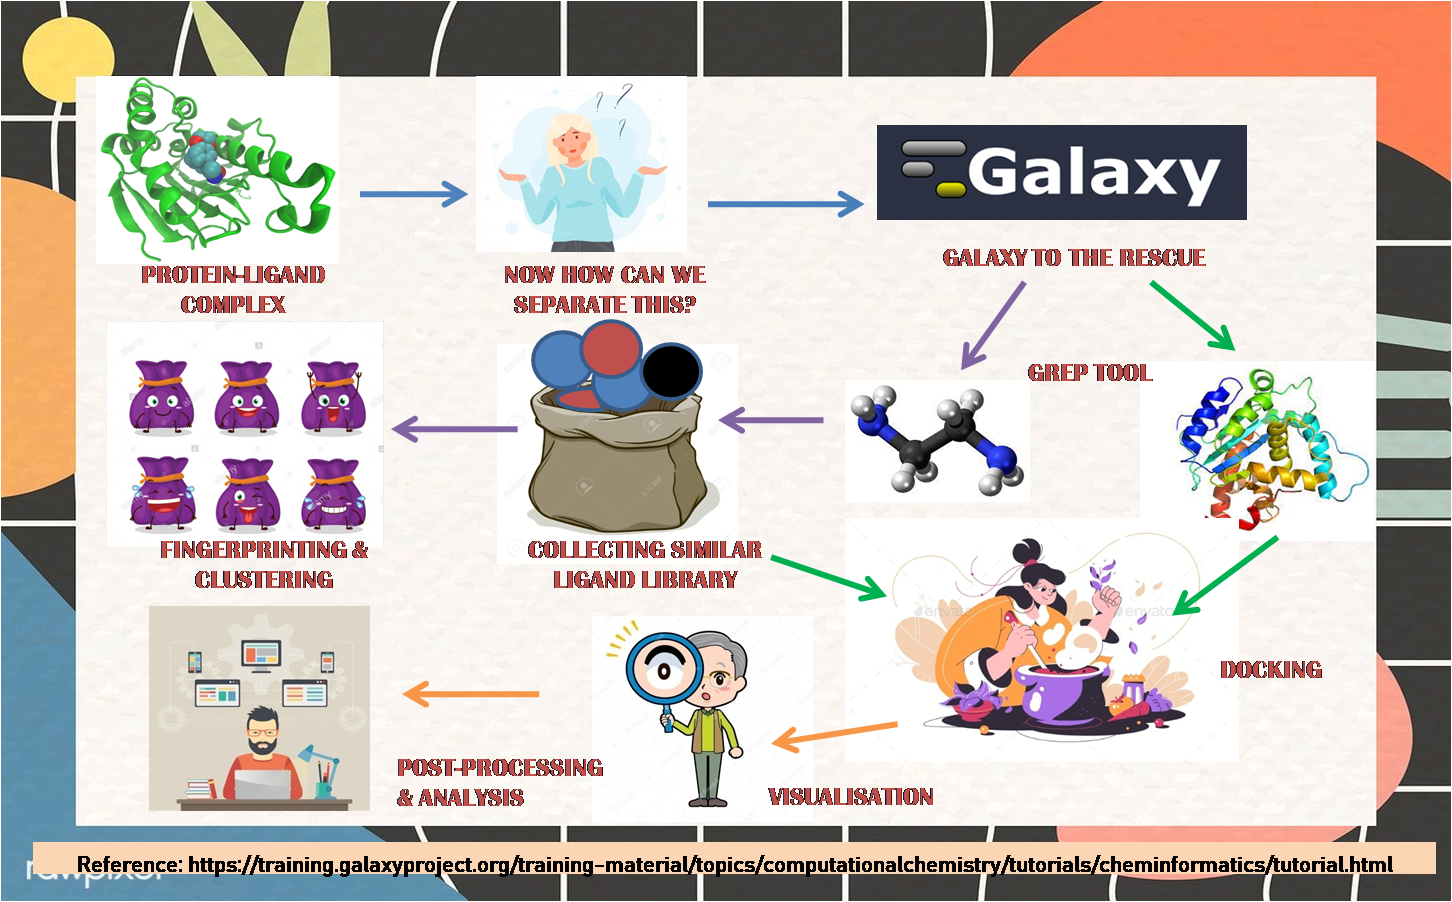
🛠️ Tools used (Galaxy)
Galaxy is an open, web-based platform for accessible, reproducible, and transparent computational research. To start with our work, do the following:
- Create a galaxy account - https://usegalaxy.eu/
- Create a new history
🛠️Get PDB
Using the accession code 2brc we get the structure of Hsp90 in PDB format.
Note that the protein and ligand are bound together
🛠️Search in textfiles (grep)
🔺 To get protein: Remove HETATM atoms (HETATM contains ligand atoms, water molecules, ions which are not part of the protein)
🔺 To get ligand: Choose only CT5 atoms (CT5 denotes the ligand atoms - you can see they come under HETATM atoms)
🛠️Compound conversion
To convert Ligand from PDB format to MOL format and also to SMILES format
🛠️Search ChEMBL database
With the SMILES of the ligand we collected in the before step, we now search for similar compounds based on SMILES in the ChEMBL Database.
We filter using the following parameters
Tanimoto coefficient: 40
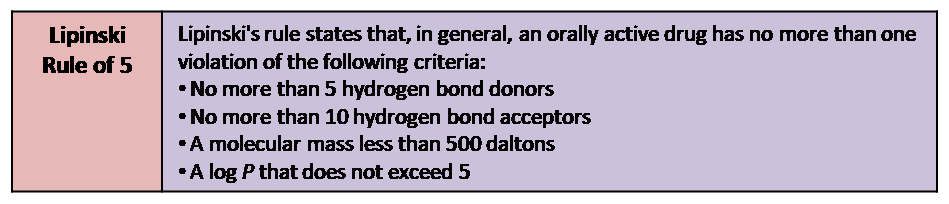
Lipinski's Rule of Five: Yes
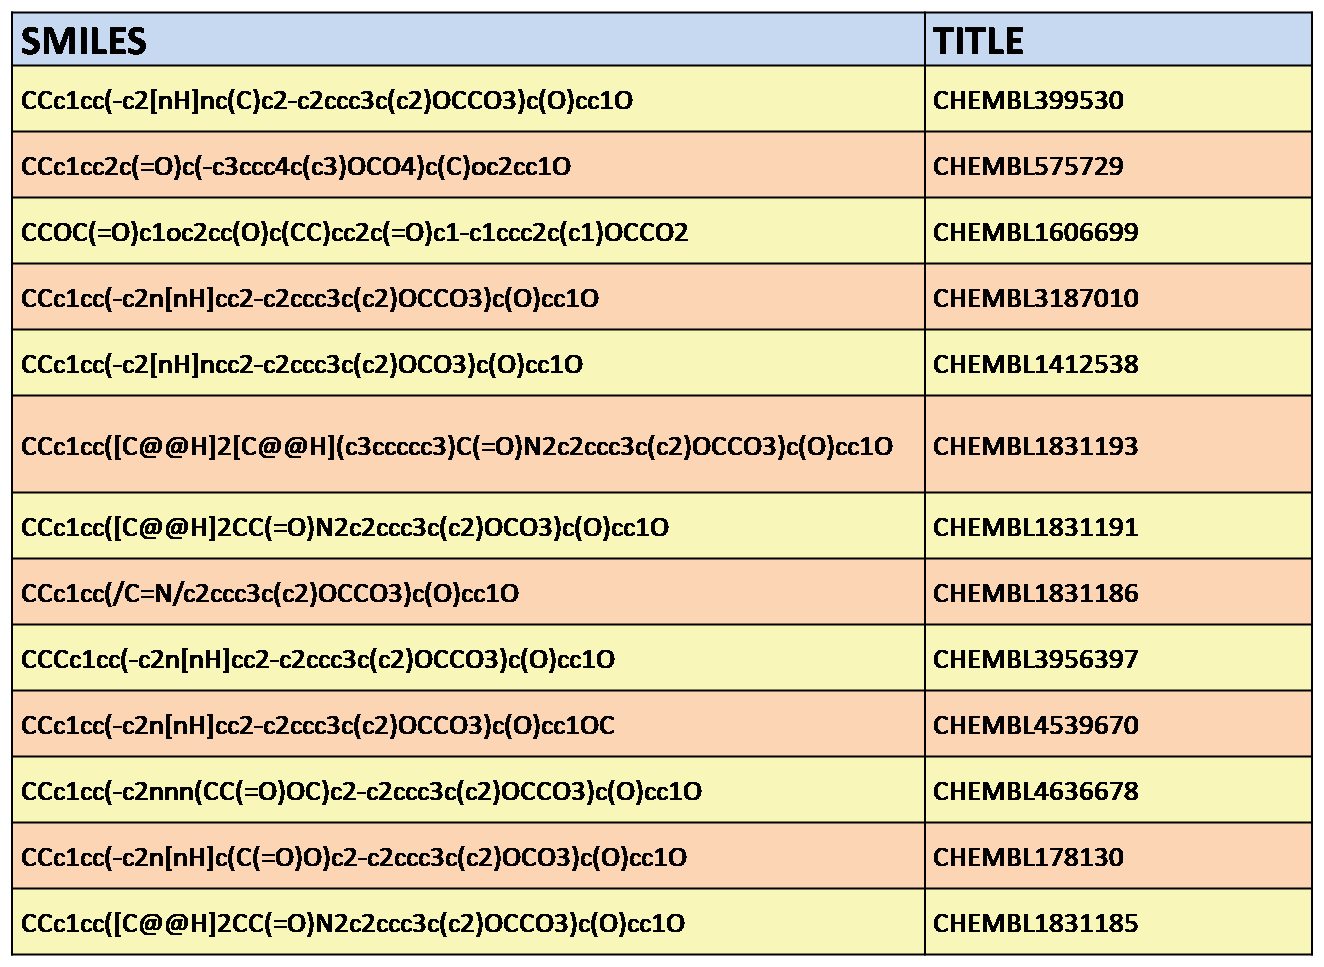
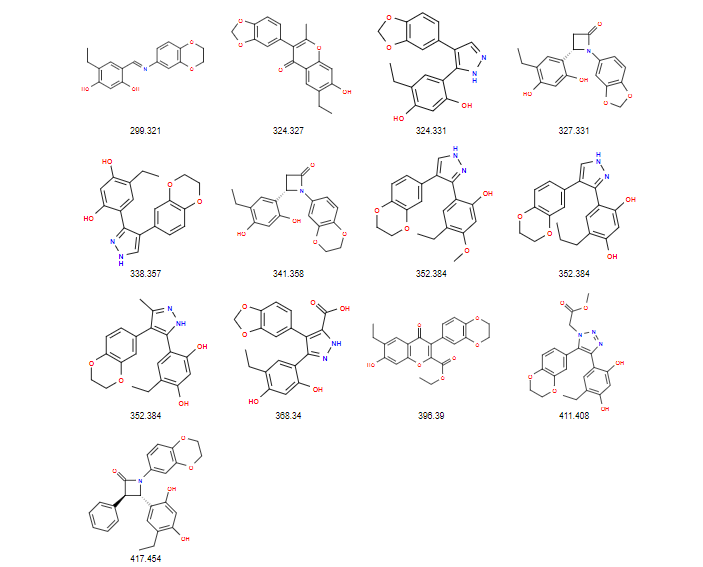
📚The Compound library created had the following compounds:
This involves pre-processing steps to make sure our protein and ligand are in the right format to dock in AutoDock Vina docking tool
🛠️Prepare receptor:
To convert our protein to PDBQT format
🛠️Compound conversion:
To convert our Compound library from SMI format to SDF format. Now our prepared ligands are ready to dock!
🛠️Calculate the box parameters for an AutoDock Vina job:
Docking requires the coordinates of a binding site to be defined. In our case, we already know the location of the binding site, since the downloaded PDB structure (Hsp90 structre) contained a bound ligand. Therefore using this we automatically create a configuration file for docking with the known ligand coordinates.
Now we will be finding the right key to our lock! We try to find the best fit for our target by performing docking.
🛠️VINA docking:
By giving our inputs of protein (PDBQT) and prepared ligands, we execute docking with the defined box configuration done in before step

We get output in the form of collection of SDF files
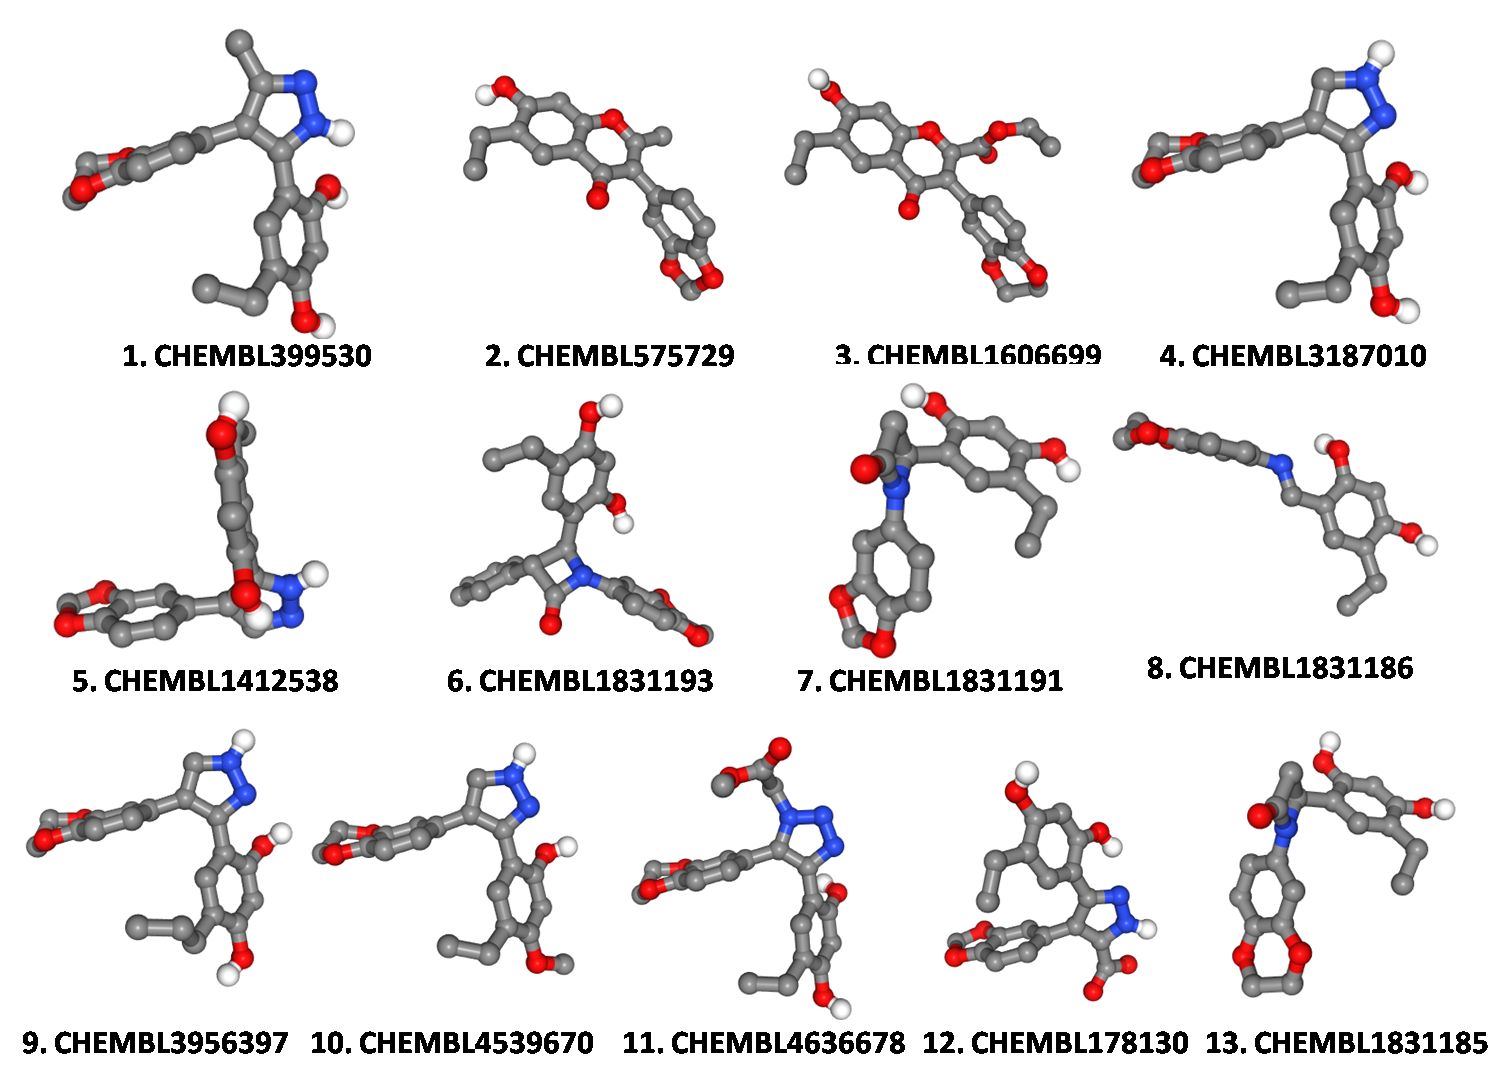
Do you wish to see how are compound library actually looks like? Here you go, we heard your words!
🛠️Visualization of Compounds:
This tool is based on OpenBabel to visualise the chemical structures of the compounds generated.
We input our 'Compound library' file and set parameters depending on how we want to visualise the compounds. In this case, we decide to see the structure of the molecule and display it's molecular weight. We can get the output in SVG or PNG format.
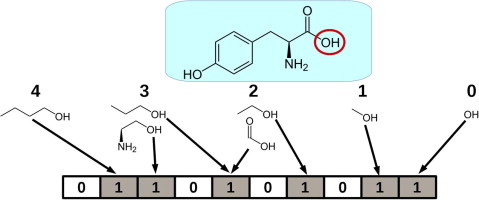
The molecular fingerprint is a way to describe a molecular structure by converting it into a bit string. Since molecular fingerprint encodes the structure of a molecule, it is a useful method to describe the structural similarity among the molecules as a molecular descriptor.
🛠️Replace:
This tool is used to replace the data format pathway in the Ligand SMILES file to 'Ligand' in title column. This is done for proper ordering and representation of the file in a tabular column.
🛠️Concatenate datasets:
This toll is used to combine our Compound library and ligand file (prepared in previous step) into a single tabular column. Therefore, now our tabular column consists of:
Columns(2): SMILES and Title (Ligand/ChEMBL ID)
Rows(14): Primary ligand file (1) + Compound library molecules (13)
Now Rename the output file as 'Labelled Compound Library'
🛠️Molecules to Fingerprints:
Now use the 'Labelled Compound Library' file to create the fingerprints. The type of fingerprint done here is Open Babel FP2 fingerprints.
Clustering of data forms the basis of many modeling and pattern classification algorithms. The purpose of clustering is to find natural groupings of data in a large data set. In this case, the bitstrings (fingerprints) obtained in previous step is compared using clustering method.
🛠️Taylor-Butina clustering:
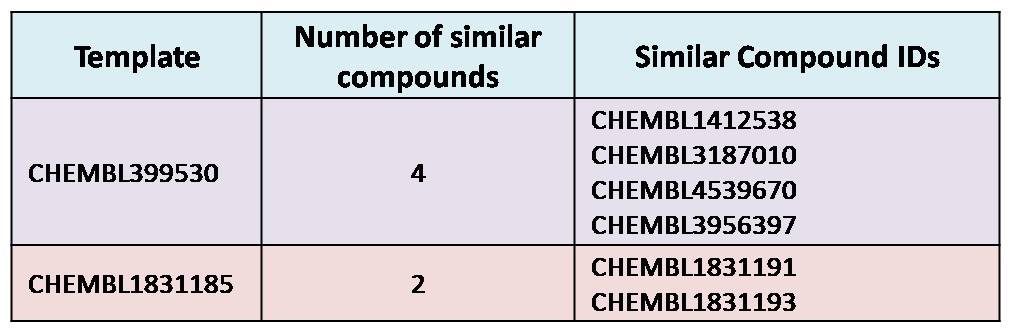
Also referred to as Leader clustering, Taylor-Butina clustering is an unsupervised non-hierarchical clustering method that guarantees that every cluster contains molecules which are within a distance cutoff of the central molecule. It provides a classification of the compounds into different groups or clusters, based on their structural similarity.
A threshold of 0.8 was used and 2 clusters were obtained.
🛠️NxN Clustering:
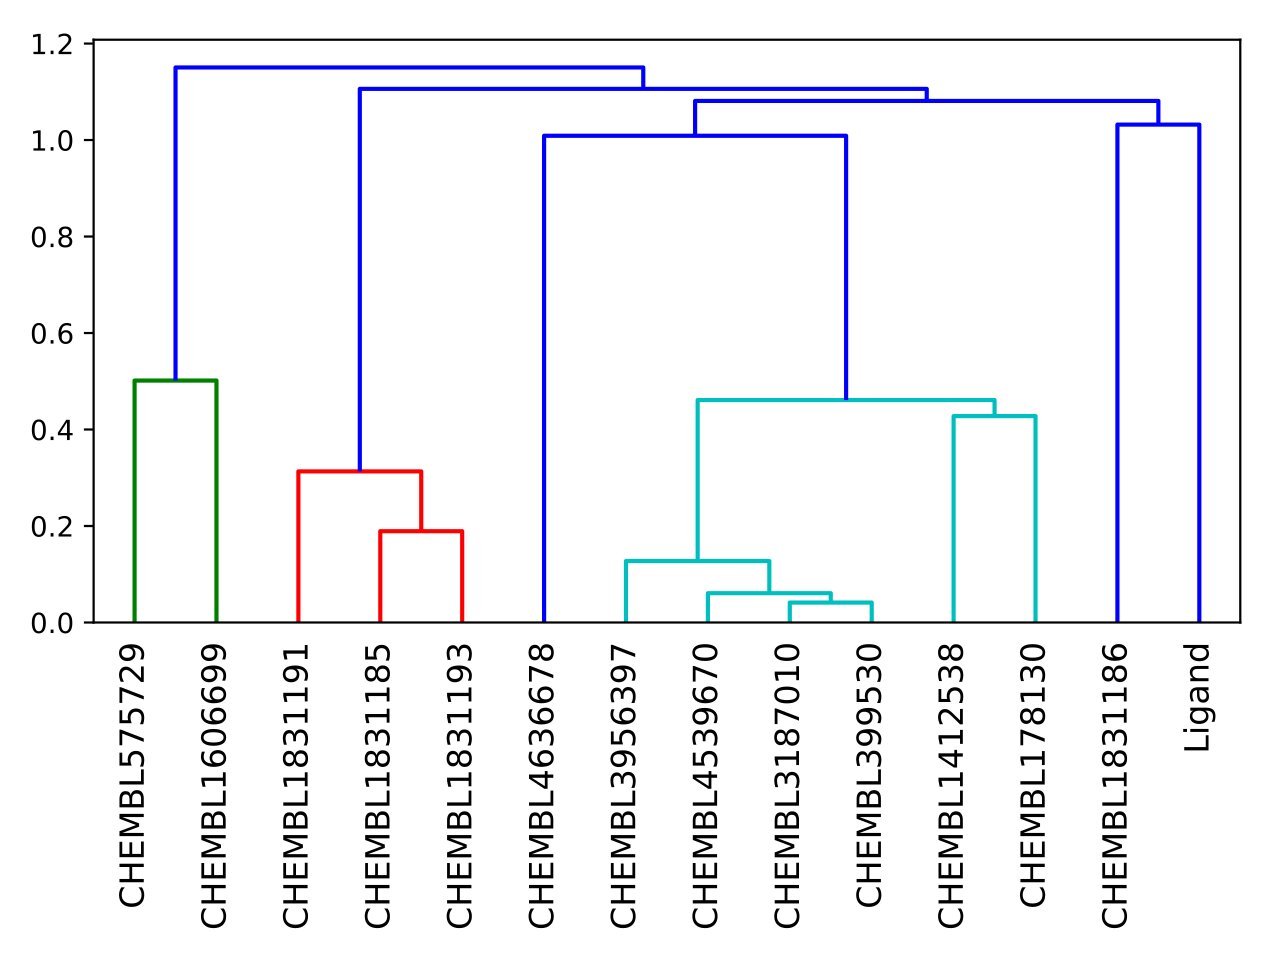
NxN clustering shows the clustering in the form of a dendrogram, where individual molecules are represented as vertical lines and merged into clusters. Merges are represented by horizontal lines. The y-axis represents the similarity of data points to each other; thus, the lower a cluster is merged, the more similar the data points are which it contains. Clusters in the dendogram are colored differently. For example, all molecules connected in red are similar enough to be grouped into the same cluster.
Output is produced in the form of an image.
As we are dont with Docking, let us now analyse our docking results.
🛠️Extract values from an SD-file:
From our collection of SD-files (docking result), we first extract all stored values into tabular format for each of the 13 ligands in the Compound library. The tabular column consists of significant values such Docking score and RMSD values.
🛠️Collapse Collection:
Using this tool we combine all the 13 tables obtained above into one single file. This helps in easier organisation and visualisation.
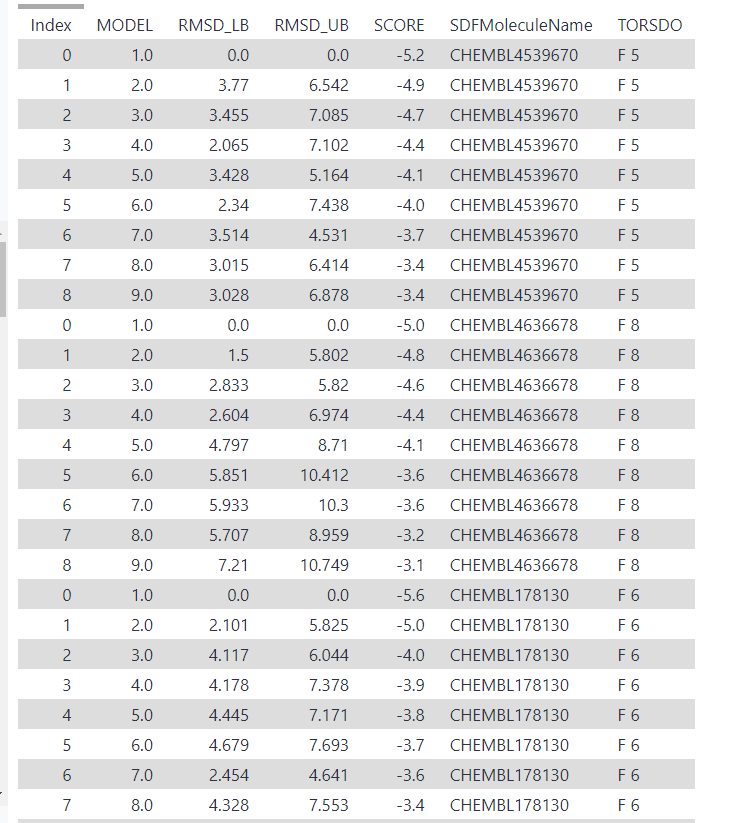
We now have a tabular file which contains all poses calculated for all ligands docked, together with scores and RMSD values for the deviation of each pose from the optimum.
🛠️Compound conversion:
Taking the Sd-files obtained from docking, we convert it to PDB format. This is done so that the docking poses can be inspected during Visualisation.
🛠️Visualisation:
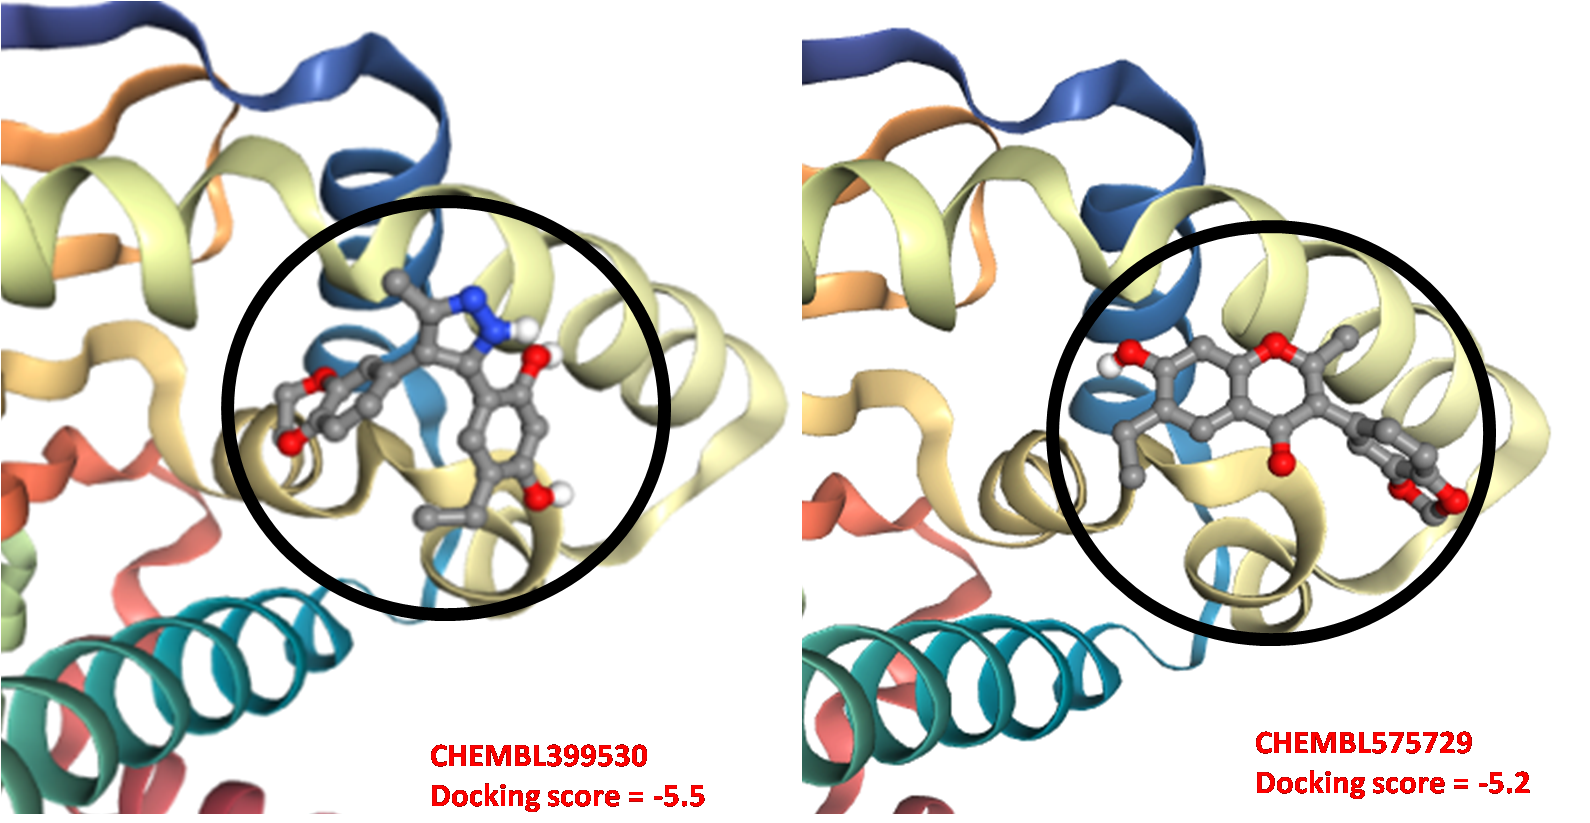
We have used NGLViewer for visualisation of our docking files. The following image shows the best ligand pose and docking score for ligands CHEMBL399530 and CHEMBL575729
🛠️Scatter plot
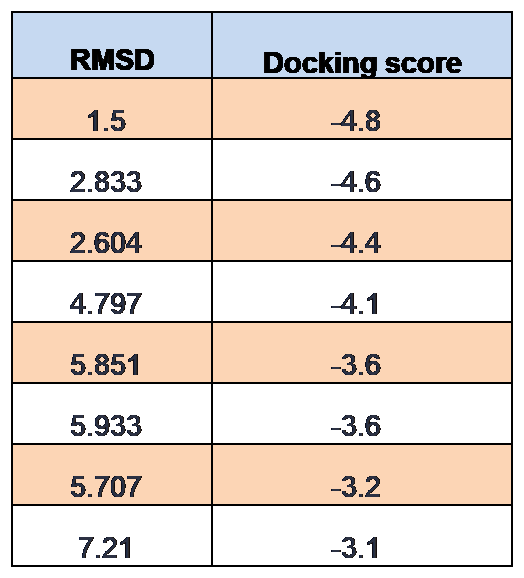
A scatter plot is a type of plot or mathematical diagram using Cartesian coordinates to display values for typically two variables for a set of data. If the variables are correlated, the points will fall along a line or curve. A scatter plot of RMSD (compared to optimal docking pose) against docking score is calculated below:
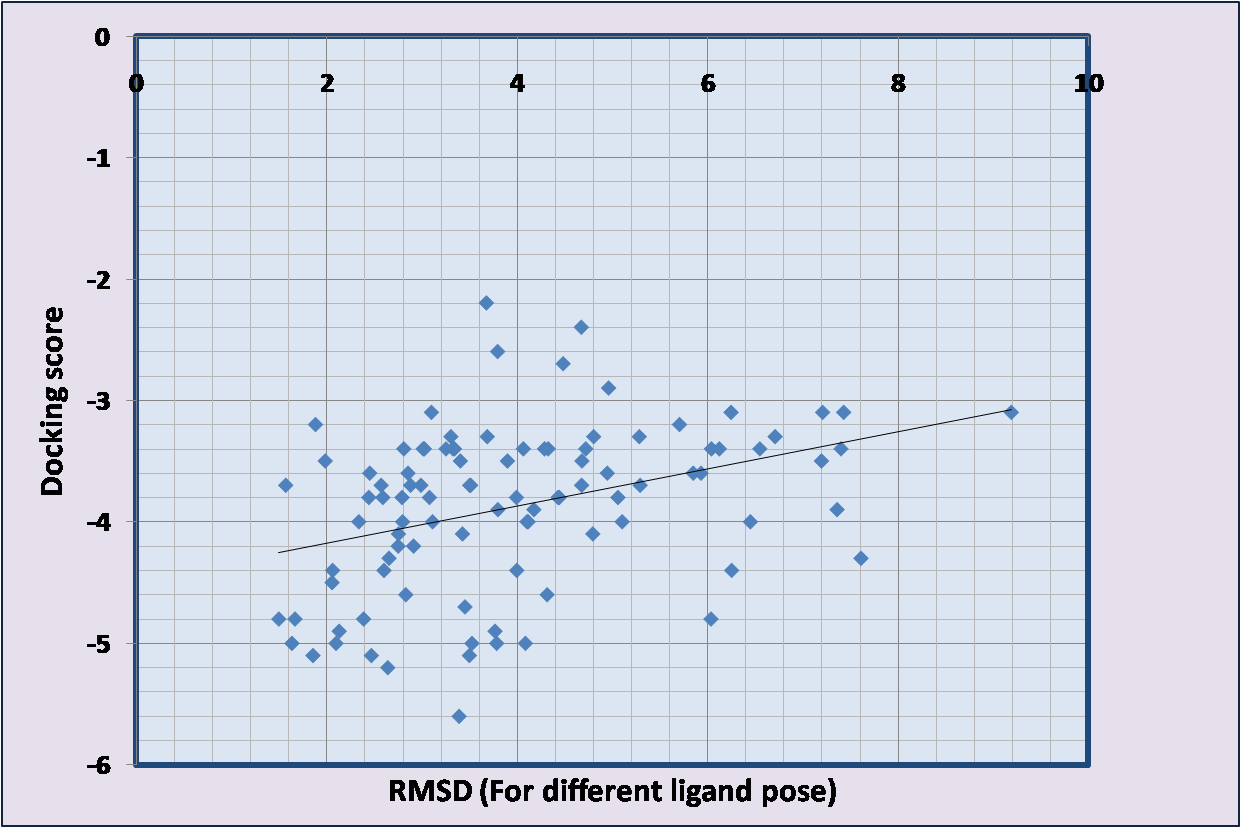
The root mean square deviation (rmsd) between corresponding atoms of two molecules is a commonly used measure of similarity between their structures. It is seen here that a linear regression plot has been observed. This proves the fact that lower the RMSD value higher is the docking score accuracy. An example tabel of one molecule (CHEMBL4636678) is attached here:
https://usegalaxy.eu/u/madhumitha_5/h/protein-ligand-docking-by-team-drugdevelopmentd
paper : Ligand-based pharmacophore modelling, virtual screening and docking studies to identify potential compounds against FtsZ of Mycobacterium tuberculosis (https://doi.org/10.1016/j.ijtb.2023.03.003)
We are grateful to Hackbio as they gave us this wonderful opportunity and let us dive into the ocean of bioinformatics.