
CloudWatch logs. One command. A clearer picture.
Tail live logs, investigate an incident across services, and keep what you find in a local archive. Hand the same search to your AI agent over MCP. Uses your existing AWS credentials. Runs on your machine.


watch-tail-hype-manga-720p.mp4
The 30-second trailer, drawn with p5.js. How it's made.
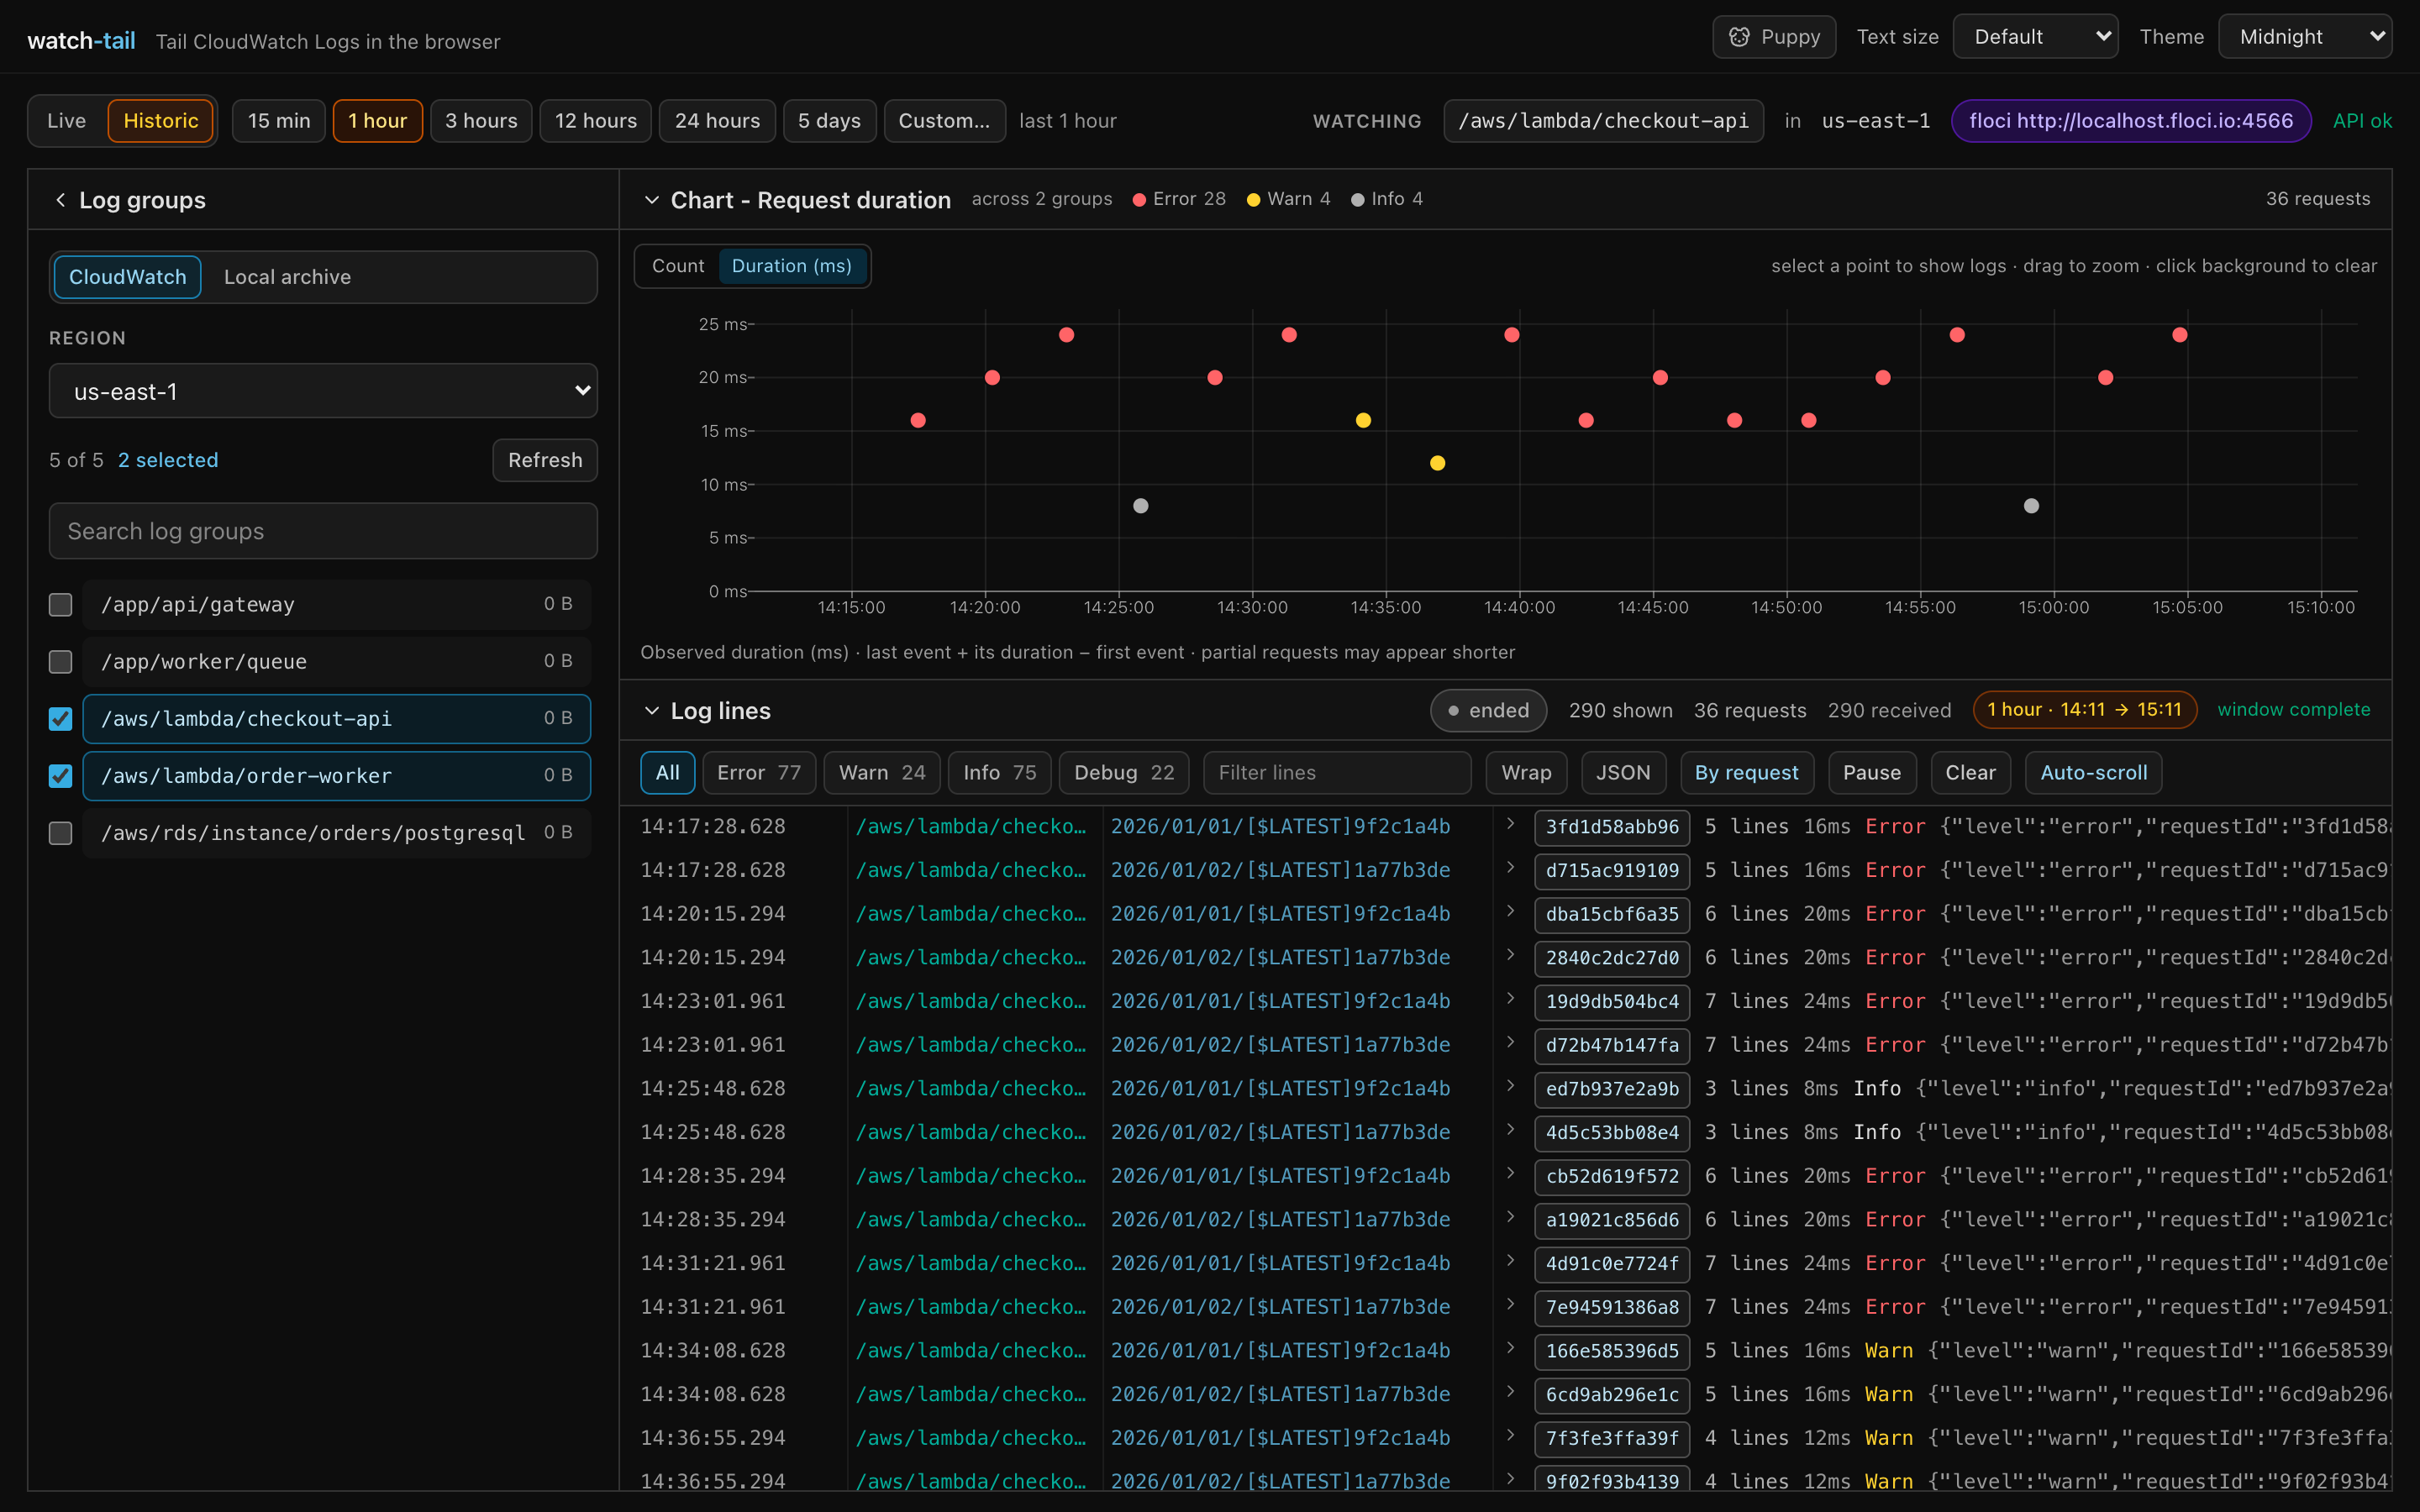
npx watch-tail                                          # use your existing AWS credentials
npx watch-tail --profile my-profile --region af-south-1  # choose a profile and region
npx watch-tail --floci                                  # use a local emulator
Requires Node.js 22+. Prefer a global install? npm install -g watch-tail gives you both
watch-tail and the shorter wt. Press Ctrl+C to stop, including during a live stream or login prompt.
- Live tail and historic scans. Follow new events or select a preset (15 minutes to 5 days) or custom window. Pause with buffering, filter text, clear the view, and toggle auto-scroll.
- Several groups, one view. Select groups in the sidebar to merge their logs and chart. A group column keeps each line's source visible, and long group names keep their most specific end.
- Panels that get out of the way. The group list, the chart and the log lines each fold from the chevron in their own header. Fold the group list to give the logs the full width, or fold the log lines to let the chart fill the space; each choice is remembered.
- Requests, not just lines. By request groups matching request IDs into one expandable row, showing line count, elapsed span, and highest severity. Lines without an ID stay visible.
- Spot the spike. In Historic mode, the chart shows request duration over time, coloured by severity. Drag to zoom into an incident; severity chips filter both chart and logs. Choose Count and switch off By request to count individual events. Collapse the chart when you want the space back.
- Readable payloads. Syntax-coloured JSON, expandable payloads, wrapping, horizontal scrolling, and resizable sidebar, timestamp, group-name and stream-name columns (drag their edges or use arrow keys). The viewer keeps a 5,000-line buffer.
- Offline history. Streamed events are saved to a local DuckDB archive. Browse them later without AWS credentials, or query them with SQL.
- Archive-first historic views. A historic window reads events the archive already holds and only asks CloudWatch for the gaps, so re-investigating an incident is fast and uses less AWS. The last few minutes of a window are always re-read, because CloudWatch can still be ingesting them. A CloudWatch filter pattern keeps that view on the API.
- Reopen the same view. Region, groups, source, mode, and time window live in the URL. A teammate needs their own AWS access or a copy of the archive; the link does not include logs or credentials.
- Your agent can look too.
watch-tail mcp initwires watch-tail into Claude Code, Claude Desktop, Cursor, VS Code and other agents, so they search the same logs and archive you do. See Agents (MCP). - Make it yours. Eight colour themes, four text sizes, and an optional puppy companion. See Make it yours.
Grouping is on by default. Click a request row to expand its lines; use By request to return to
individual events. IDs are detected from requestId, request_id, awsRequestId, x-request-id,
and Lambda's RequestId: lines. Each request takes the severity of its most critical line.
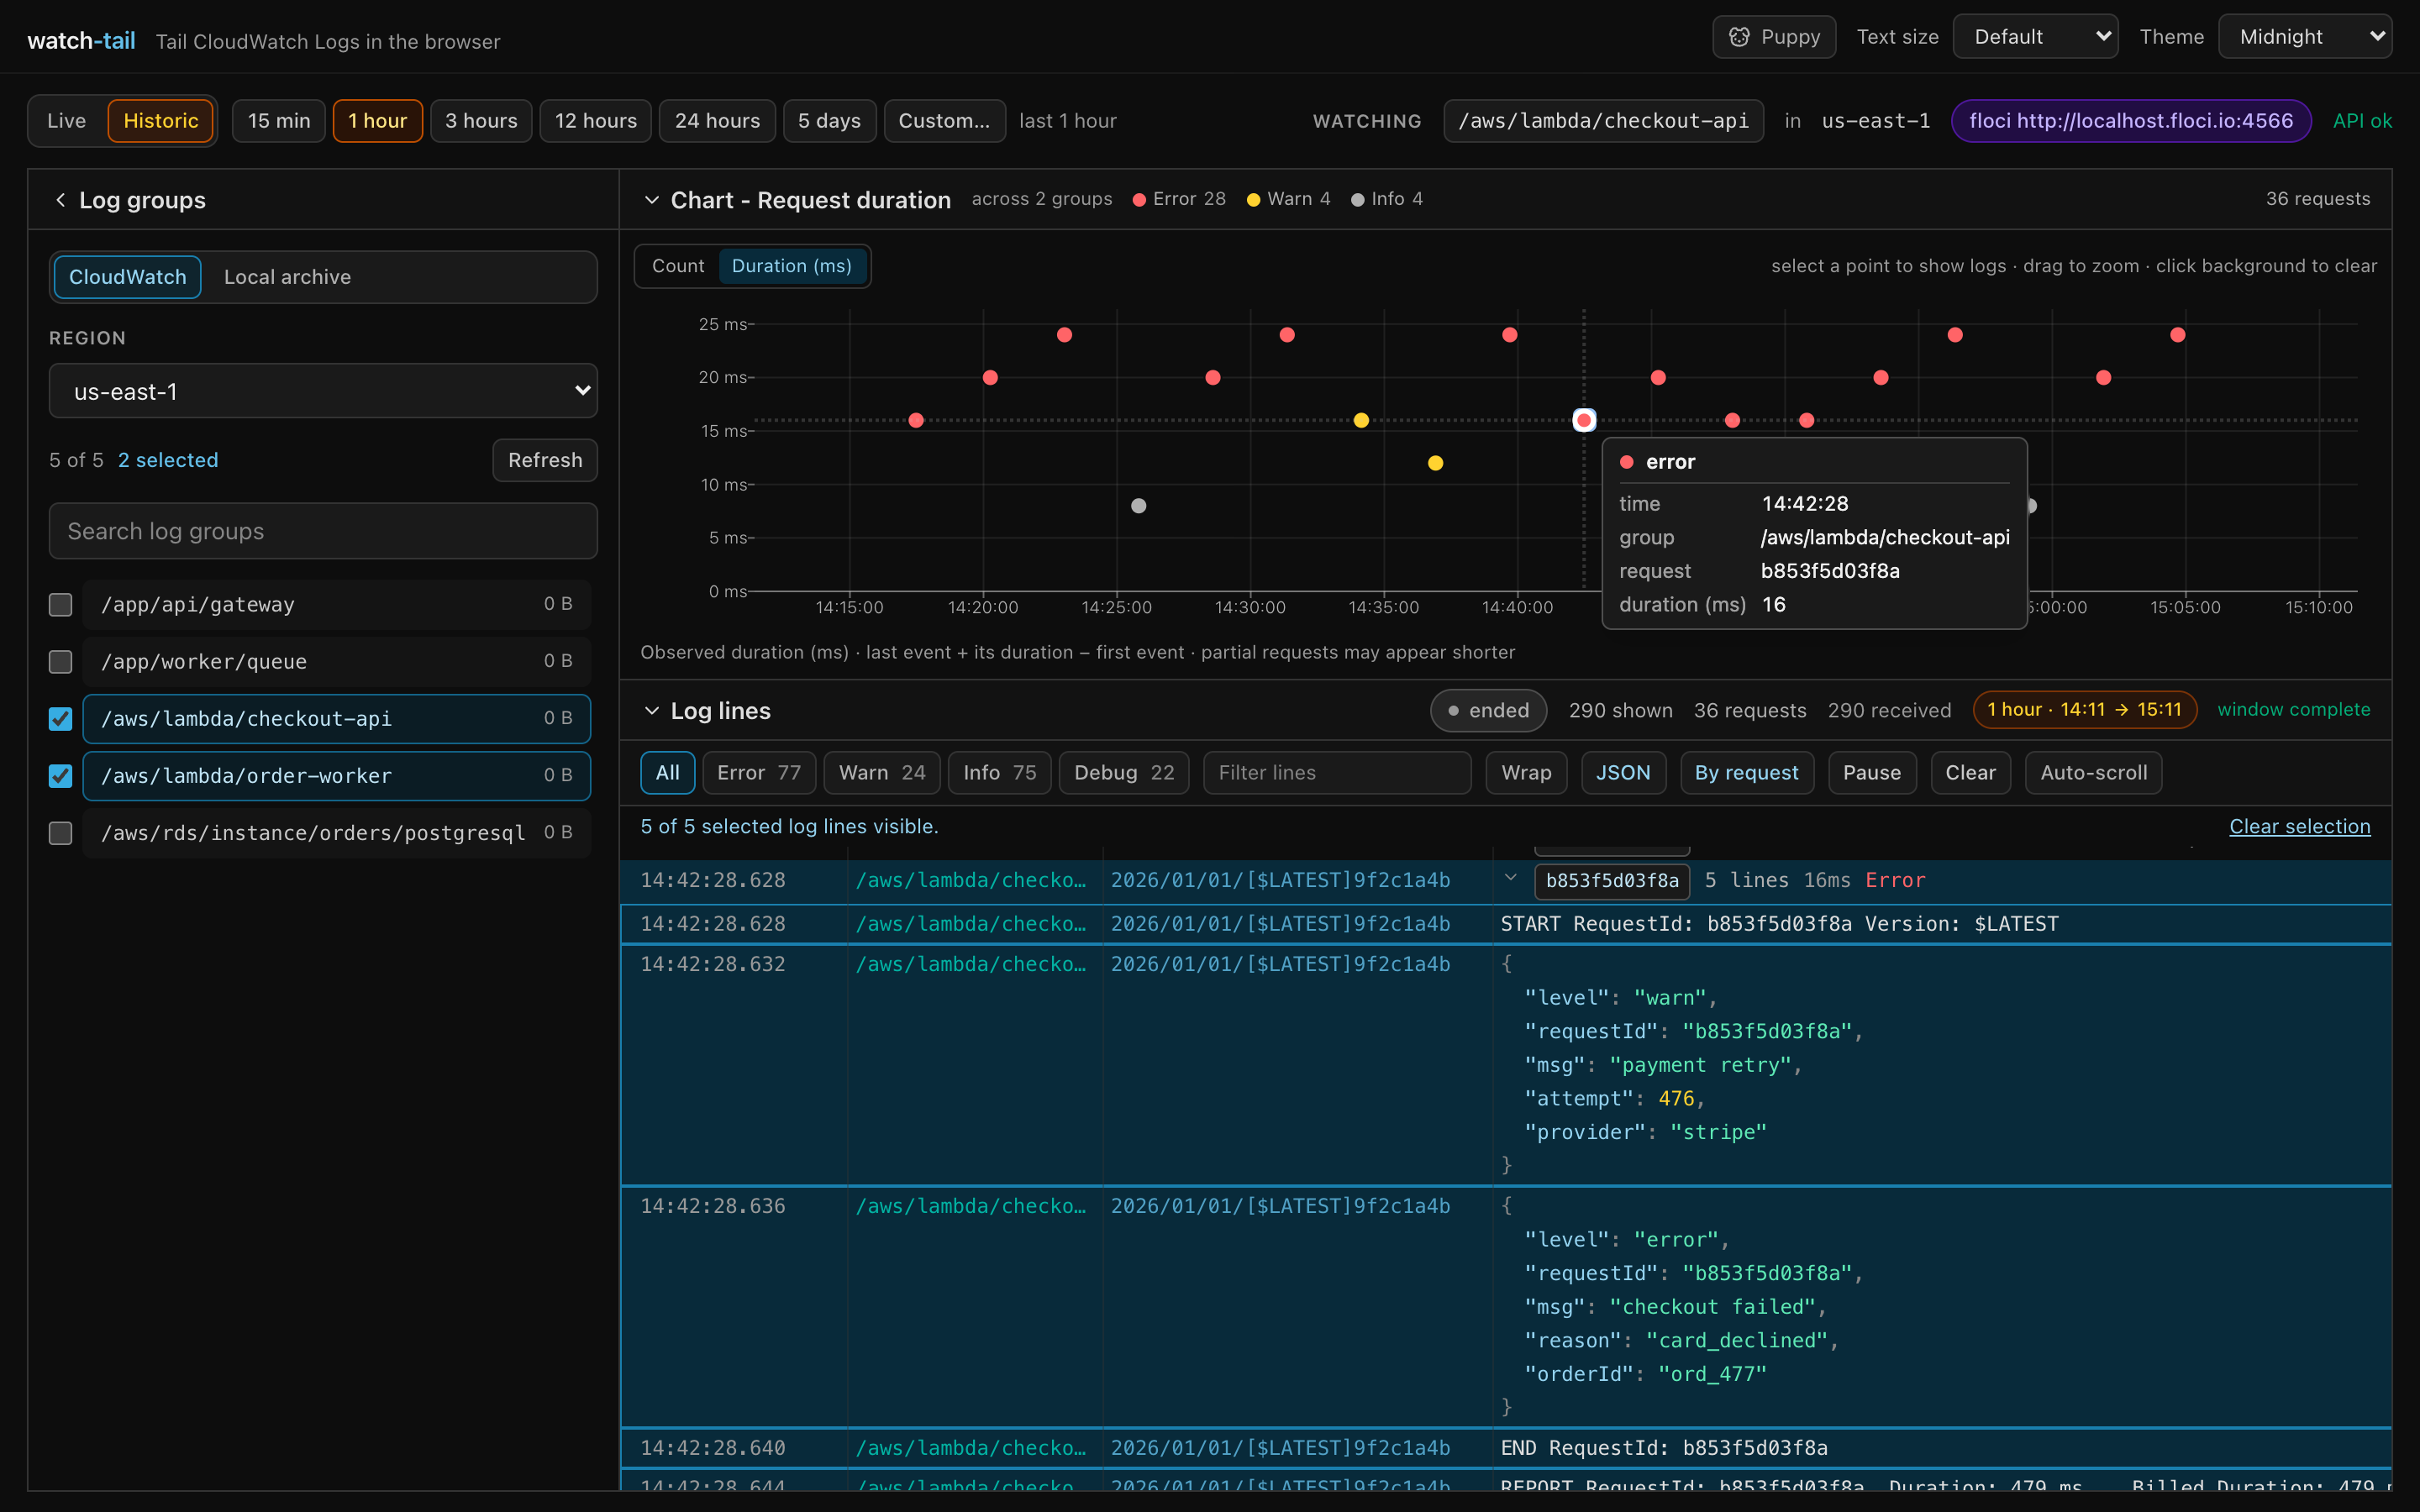
Select a chart point to scroll to and highlight its loaded log lines. Requests expand automatically, and auto-scroll switches off so incoming logs do not move you away. Count points select all matching events or requests in that bucket; duration points select one request. Use Clear selection to remove the highlight. If filters hide selected lines or they are outside the loaded buffer, the viewer shows a message.
In Historic, drag across the chart to narrow the window. Click the background to clear the brush, or use Reset zoom to restore the preset. CloudWatch charts reflect the events loaded into the viewer; archive charts query the whole selected window.
The chart stays fixed above the scrolling logs and defaults to Duration (ms), with one point per request: X is its first
observed event timestamp; Y is (last timestamp + last event duration) − first timestamp in
milliseconds. The last event's JSON duration (or durationMs) is used when present; otherwise it
adds zero. Hover for the request ID and duration. Severity filters and chart zoom work in both modes.
Only events with request IDs contribute; incomplete windows can show partial durations.
Choose Local archive to browse events already captured on this machine, even offline or with an expired SSO session. Only events received while streaming are archived; it does not back up your whole AWS account.
Historic views do not need you to switch source: with CloudWatch selected, a historic window is answered from the archive wherever it already has the events, and only the ranges it has never seen are fetched from AWS. watch-tail remembers which ranges it read from CloudWatch in full and stored, so a window you looked at before is fast and cheap the next time. The last five minutes of each read are always fetched again, because CloudWatch can still be ingesting them. A filter pattern disables this, because that scan archived only the matching lines. Local archive stays the way to read windows older than CloudWatch's 14-day limit.
watch-tail --db ./logs.duckdb   # choose an archive file
watch-tail --no-archive        # disable archiving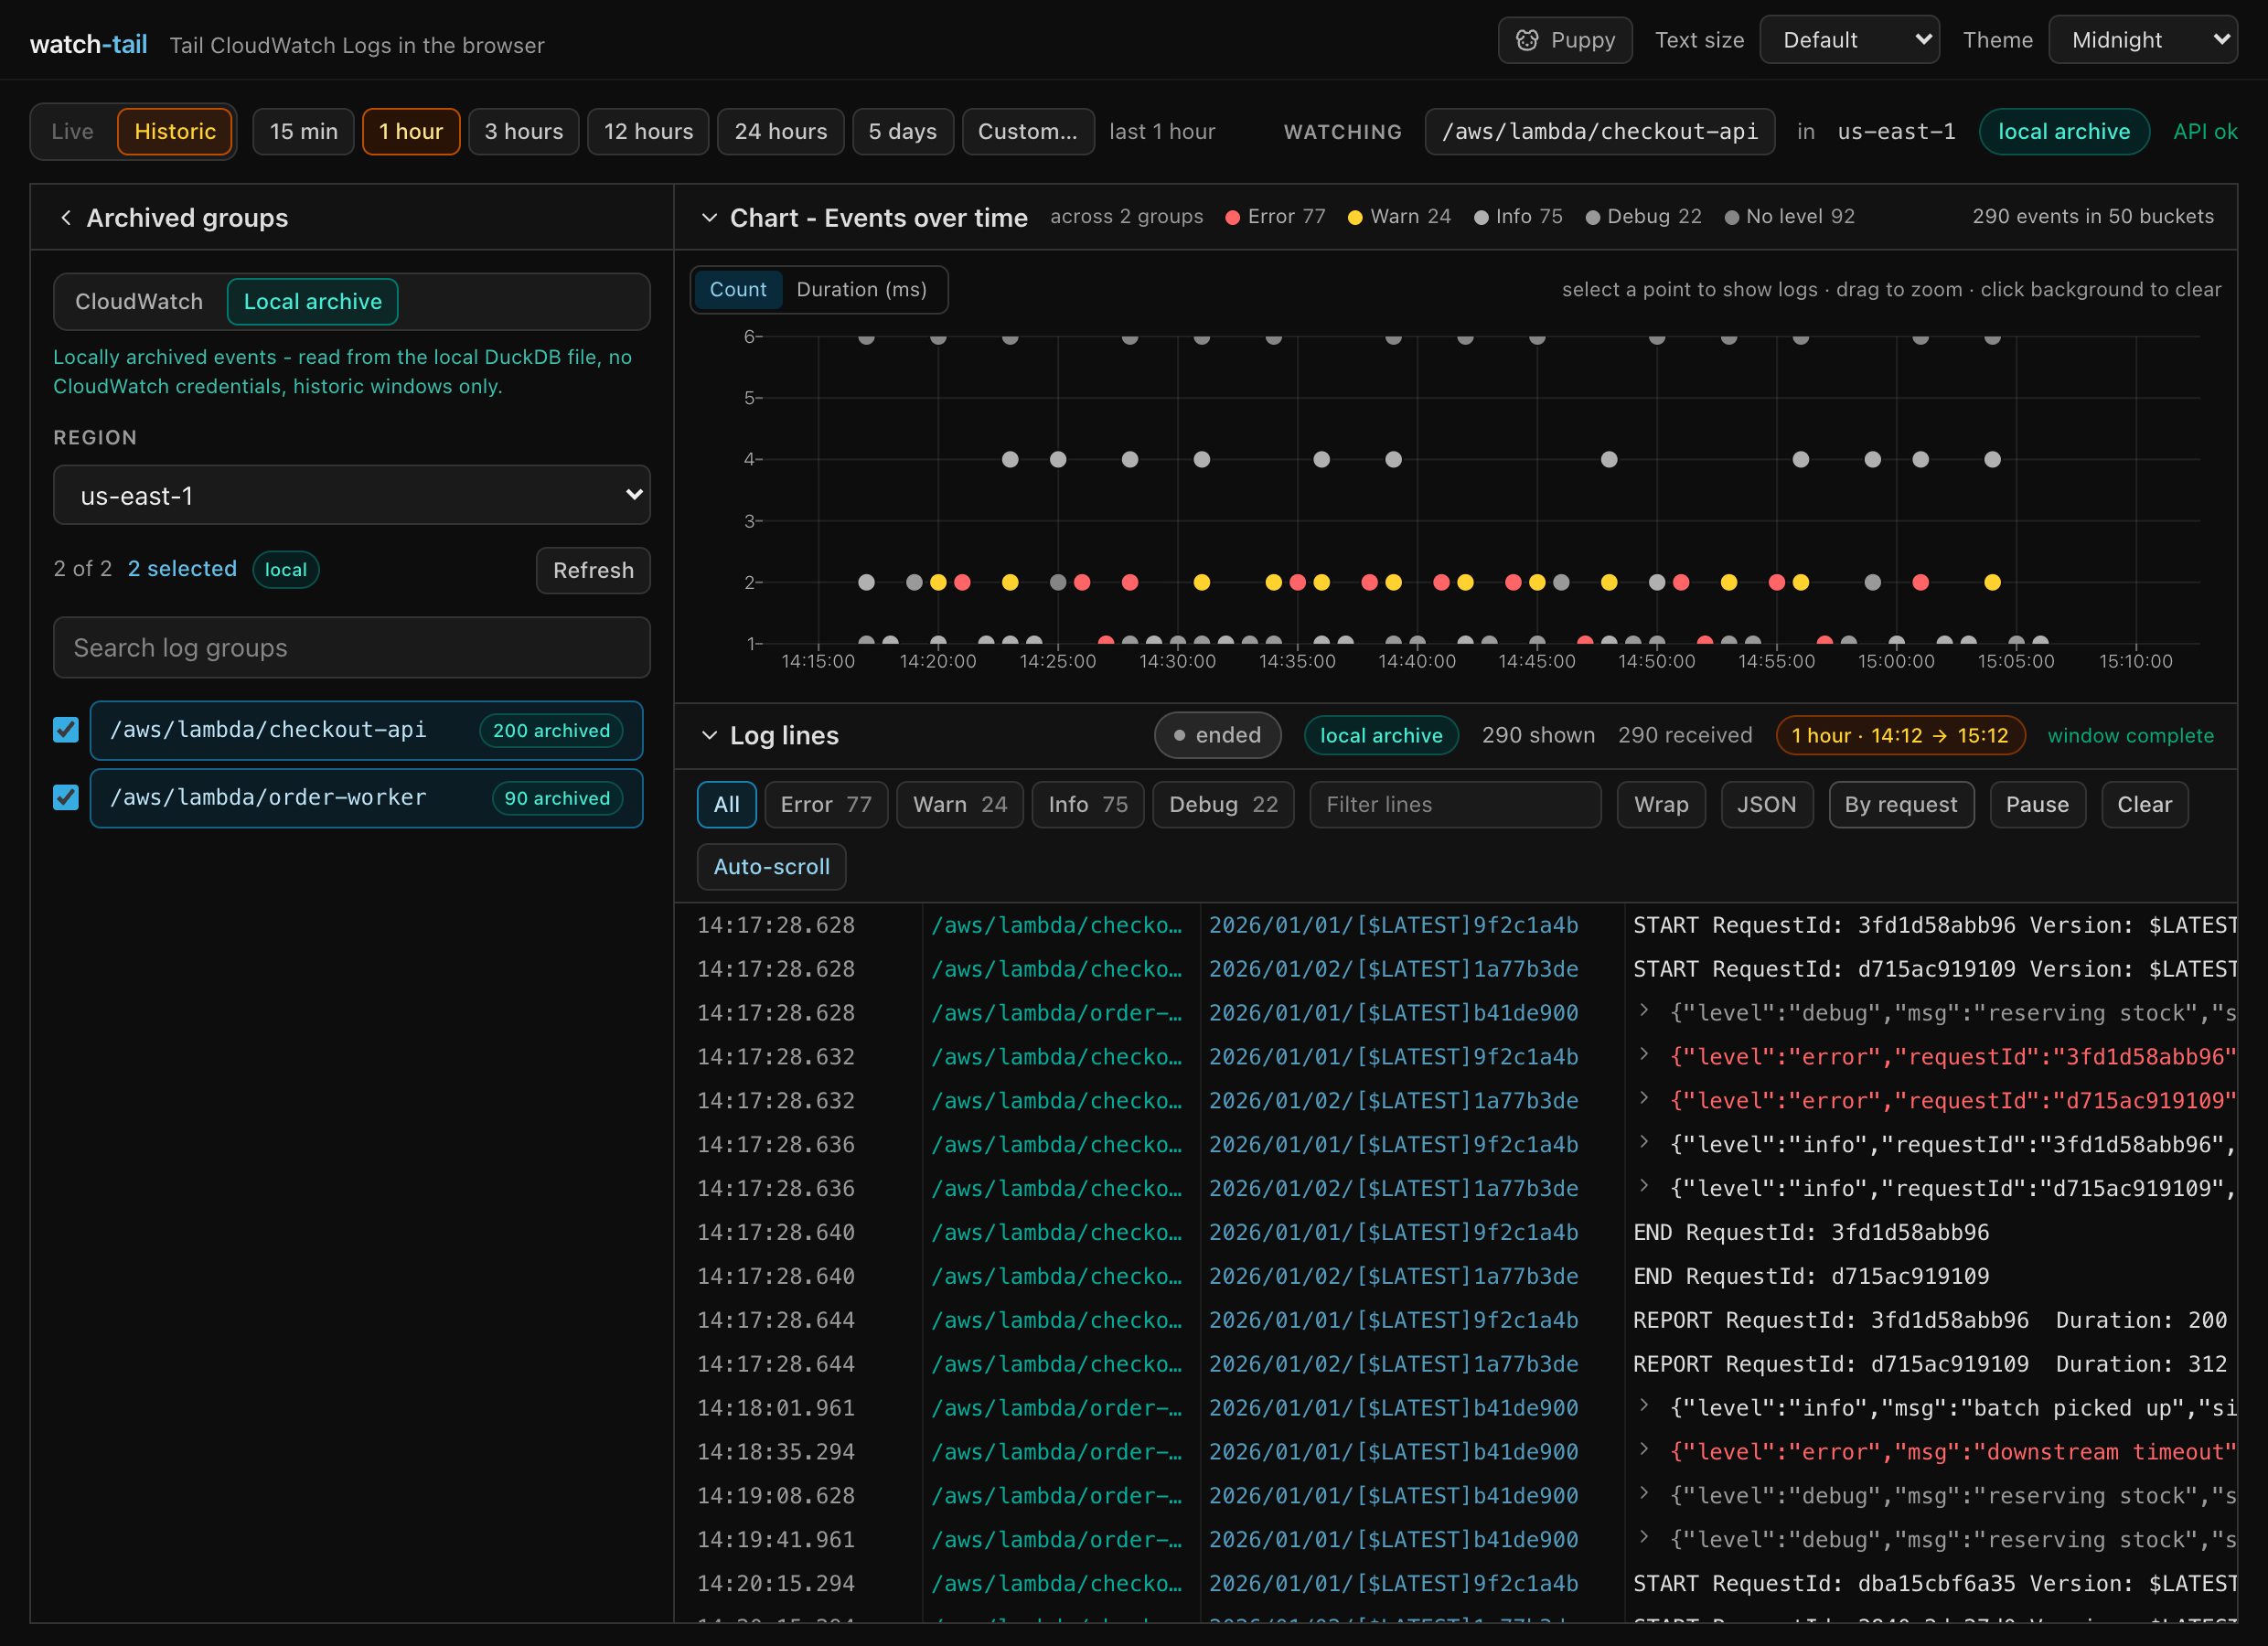
Each AWS account and region gets its own <account-id>/<region>/archive.duckdb beneath:
| Platform | Directory |
|---|---|
| macOS | ~/Library/Application Support/watch-tail/ |
| Linux | ${XDG_DATA_HOME:-~/.local/share}/watch-tail/ |
| Windows | %LOCALAPPDATA%\watch-tail\ |
Account IDs come from AWS STS, so two profiles for the same account share its regional archive. Changing regions switches files automatically. Emulator endpoints have a separate namespace. Account mappings are cached locally for offline reads; a new CloudWatch stream verifies its account before archiving. If verification fails, logs still stream but are not archived.
Existing archive.duckdb files stay untouched. Open a legacy archive with --db /path/to/archive.duckdb.
--db deliberately overrides automatic account/region separation: use it to inspect an existing file
or manage a file yourself. For offline access on another machine, copy the regional database and
open it with --db.
DuckDB is optional: if its native driver cannot load, the viewer runs without archiving. One process
can own an archive file at a time; use separate --db paths for concurrent instances. To inspect it
with a DuckDB client, stop the app first:
SELECT log_group, level, count(*) AS events
FROM log_events
GROUP BY log_group, level
ORDER BY events DESC;
CloudWatch scans in this app are limited to the last 14 days; actual AWS retention depends on the log group's settings. The local archive can retain events beyond that window.
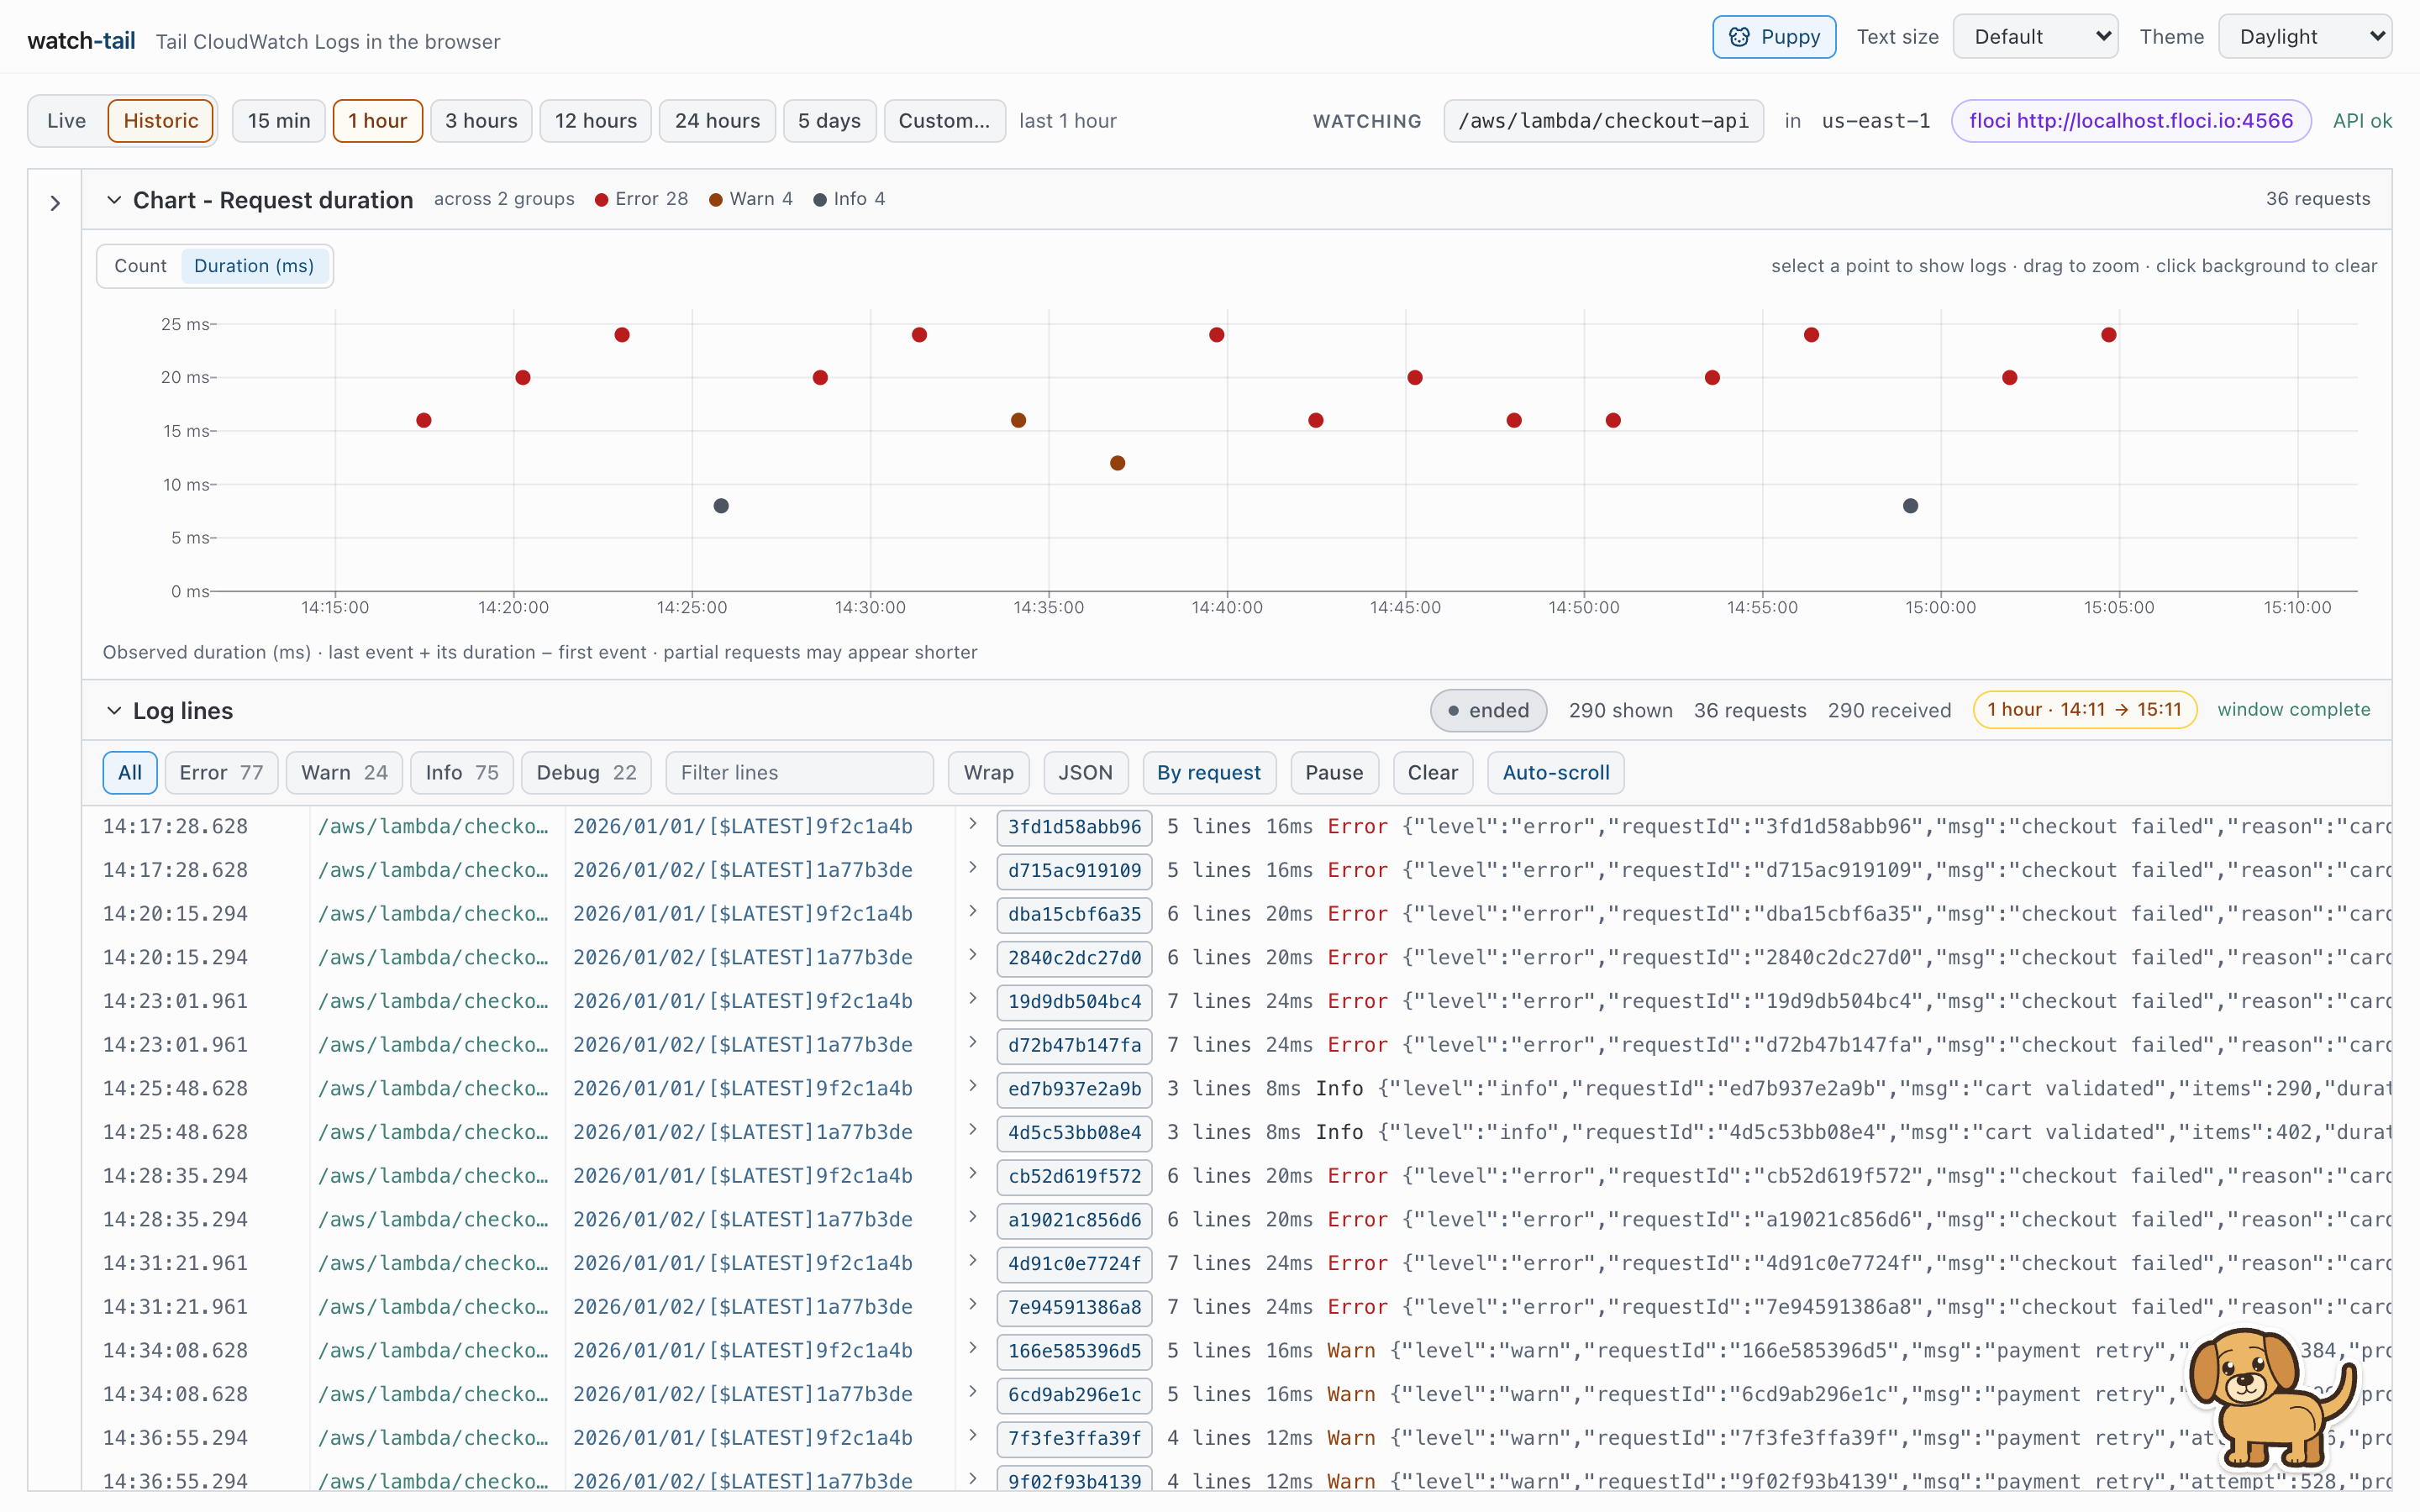
Choose a Theme from the header: Midnight, Ocean, Forest and Plum are dark palettes; Daylight, Sand, Mint and Lavender are light palettes. It covers the controls, log severities, JSON colours and the chart.
Need the interface larger or smaller? Text size offers Small, Default, Large and Extra large. It scales the whole UI, including the log view.
Want company? Press Puppy in the header to bring out a Labrador puppy in the bottom-right corner. It wags its tail whenever data loads and whenever you fold or unfold a section, and gets excited when you click it. Drag it (or focus it and use the arrow keys) to move it to another corner. Press Puppy again to send it away. If your system asks for reduced motion, it draws wag marks instead of animating its tail and moves between corners without sliding.
The theme, text size, puppy corner, panel layout and column widths are all remembered in this browser.
watch-tail can run headless as a local MCP server, so an agent can search CloudWatch and the local archive directly instead of calling AWS itself. The server starts a private watch-tail on a free loopback port, proxies the same API the browser uses, and stops it when the agent disconnects. Nothing is written to stdout except the protocol.
watch-tail mcp          # speak MCP over stdio (an agent starts this for you)
watch-tail mcp init     # detect installed agents and configure them
mcp init looks for Claude Desktop, Claude Code, Cursor, Windsurf, VS Code, Gemini CLI and the
Codex CLI, lists the ones it finds, and asks which to configure. It merges a watch-tail server
entry into each selected agent's config file, leaving everything else in the file alone, and never
clobbers a file it cannot parse. Useful flags:
| Flag | Meaning |
|---|---|
--agent <ids> |
Configure these agents (comma separated), skipping detection/prompt |
--yes |
Configure every detected agent without asking |
--print |
Show the configuration instead of writing it |
--scope <scope> |
user (default) or project (the current directory) |
--command/--args |
Run a local build instead of the published package |
For a checkout rather than an installed package:
watch-tail mcp init --command node --args /path/to/watch-tail/dist/cli/bin.jsThe agent gets five tools: archive_status, list_log_groups, search_logs, count_logs and
get_identity. Every search is a bounded historic window, matching the UI's Historic mode, and
source="cloudwatch" is the default: it reads the local DuckDB archive first and only calls AWS for
windows it does not already hold, so it is fast and complete. Use source="archive" to stay entirely
on this machine - no AWS calls, and no 14-day limit. search_logs accepts a substring (search) and
level filters on the archive, or a CloudWatch filterPattern. Results are sorted oldest first, and
limit (500 by default) caps a search on either source. Searching does not silently pull your
whole history: only the windows you ask for are archived, and only the events actually streamed.
DuckDB lets one process use an archive file at a time. The MCP server's private watch-tail opens it
only while a tool call runs, so it does not lock out the browser UI; a watch-tail UI, however, holds
the archive for as long as it runs. To have an agent use a UI you keep open instead of starting a
second server, add "--url", "http://127.0.0.1:4517" after "mcp" in the args of its
watch-tail entry. Running mcp init again resets command and args (and keeps everything else
in the entry), so add it back afterwards.
The server speaks the Model Context Protocol through tmcp: the session handshake
(2025-06-18 and earlier) and the stateless 2026-07-28 revision with per-request metadata.
watch-tail [options]

  -p, --profile <name>   AWS profile to use (default: ambient credentials)
  -r, --region <code>    Region to open on (default: profile region, else AWS_REGION)
      --endpoint <url>   Point the app at a local emulator instead of AWS
      --floci            Shorthand for --endpoint http://localhost:4566
      --port <number>    Port for the local UI (default 4517)
      --host <address>   Interface to bind (default 127.0.0.1, loopback only)
      --no-open          Do not open a browser window
      --print            Print the environment that would be used, then exit
      --list             List the AWS profiles found on disk, then exit
      --verbose          Log the server's own output
      --db <path>        Explicit archive file (default: per account and region)
      --no-archive       Do not keep a local history archive
  -h, --help             Show this help
  -v, --version          Show the version

  watch-tail mcp [options]        Serve watch-tail to an AI agent over stdio
      --url <url>         Use a watch-tail already running at this URL
  watch-tail mcp init [options]   Write watch-tail into installed agents
      --agent <ids>       Configure these agents (comma separated)
      --yes               Configure every detected agent without asking
      --print             Print the configuration instead of writing it
      --scope <scope>     Where to write: user (default) or project
      --command <exe>     Executable written into the agent config (default: npx)
      --args <args>       Arguments written before `mcp`
Shell completions support zsh, bash, fish, and PowerShell, including your AWS profile names and available regions:
source <(watch-tail complete zsh)Uses the AWS SDK credential chain: SSO, shared config, environment variables, or an instance role. The server binds to loopback by default. No vendor account or deployed agent is needed.
aws sso login --profile my-profile
wt --profile my-profile
The app reads logs using these IAM actions:
{
	"Version": "2012-10-17",
	"Statement": [
		{
			"Effect": "Allow",
			"Action": ["logs:DescribeLogGroups", "logs:FilterLogEvents"],
			"Resource": "*"
		}
	]
}
If credentials fail, the CLI can help you choose a profile and offer aws sso login or aws login
as appropriate. Working profiles are checked before offering login. In a non-interactive session it
prints the command to run instead.
Region precedence: --region, AWS_REGION / AWS_DEFAULT_REGION, the chosen profile, then the
default profile. Use --floci or --endpoint to select an emulator explicitly; emulator settings
from the checkout's .env.local do not silently redirect a normal CLI run.
Development needs Node.js 22.18+, which runs the TypeScript scripts in scripts/ directly;
pnpm and npm refuse to install or run scripts on anything older. With floci
installed:
pnpm install
pnpm floci:up       # start the emulator and write its dev environment
pnpm seed          # demo logs; use pnpm seed:watch for live traffic
pnpm dev           # http://localhost:5173
Use pnpm dev:aws --profile my-profile to develop against AWS instead.
| Command | Purpose |
|---|---|
pnpm verify |
Types, lint, formatting, tests, unused-code checks, and build |
pnpm test:e2e |
Emulator integration tests (requires floci) |
pnpm test:cli |
Built CLI startup and shutdown checks (Python 3 for terminal tests on macOS/Linux) |
pnpm test:ui |
Browser smoke checks against the running app |
pnpm build / pnpm start |
Build and run the production CLI |
pnpm publish:check |
Validate package metadata, tarball contents, size budget and runtime imports |
See ARCHITECTURE.md for internals, CHANGELOG.md for release history, and RELEASING.md for the Changesets and npm staged-publishing workflow.