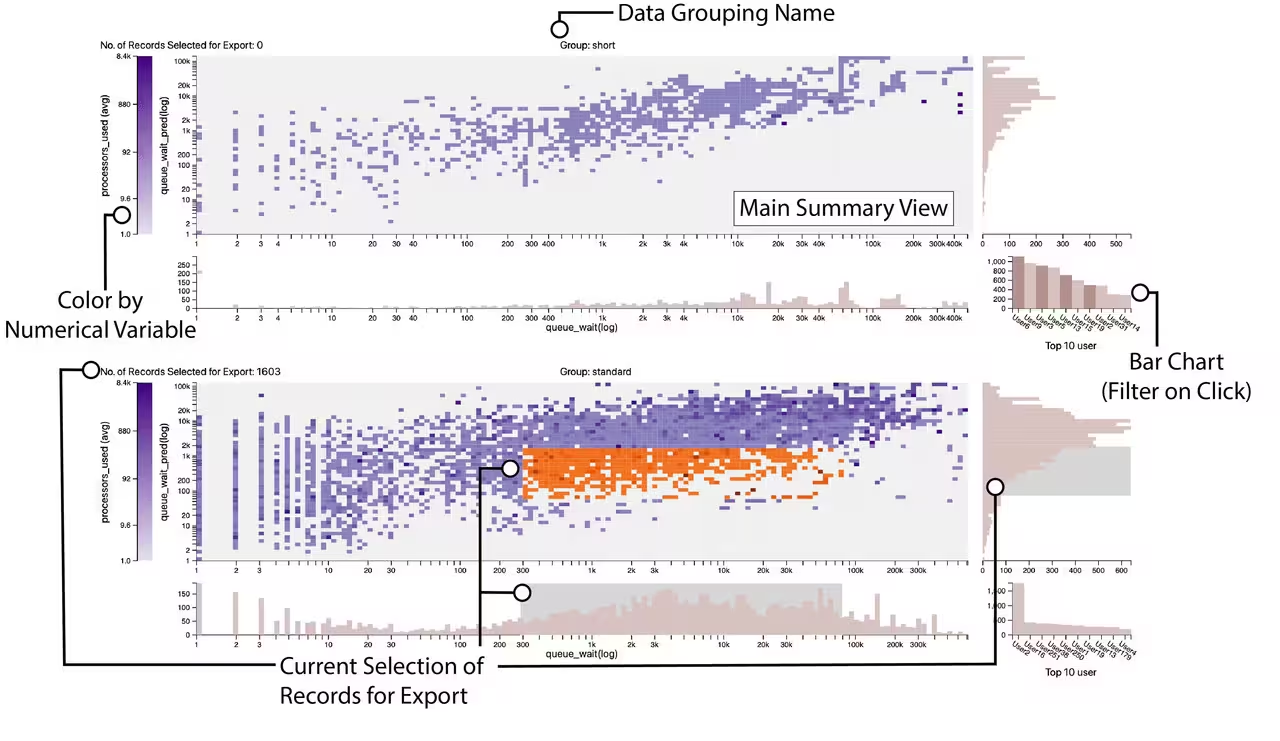
Guidepost is a Python library for visualizing High Performance Computing (HPC) job data in Jupyter notebooks. It turns a pandas DataFrame of job records into a single, linked, interactive overview — faceted heatmaps framed by histograms, a categorical bar chart, and a brushable color legend — so you can spot patterns in runtimes, queue waits, and resource usage, then export the exact records you care about back into Python.
pip install guidepostfrom guidepost import Guidepost
import pandas as pd
gp = Guidepost()
gp.load_data(pd.read_parquet("data/jobs_data.parquet"))
gp # display in a notebook cellBrush the heatmap or its histograms, then pull the selected rows back into Python:
df = gp.selection.dataframeInput is a pandas DataFrame with at least three numeric and two categorical columns (datetime columns are supported on the x-axis).
Full documentation lives in the Guidepost Wiki:
- Getting Started
- Data Requirements and Type Detection
- Configuration
- Understanding the Views — and the per-view interaction guides
- Selecting and Exporting Data
- API Reference
- FAQ and Troubleshooting
Contributions are welcome. Fork the repository, create a branch for your feature or bugfix, and open a pull request with a description of your changes.
Guidepost is licensed under the MIT License. See the LICENSE file for details.
Guidepost was developed under the auspices and with funding provided by the National Renewable Energy Laboratory (NREL), the National Science Foundation under NSF IIS-1844573 and IIS-2324465, and the Department of Energy under DE-SC0022044 and DE-SC0024635.
For questions or feedback, reach out to the maintainer at [cscullyallison@sci.utah.edu].