In her book, Weapons of Math Destruction: How Big Data Increases Inequality and Threatens Democracy, Cathy O’Neil identifies the US News & World Report’s ranking for excellence of colleges and universities across the US as a harmful model that ultimately hurts colleges, students, parents, and educators alike.

The US News’ rankings are held in high regard and are quite influential in the decisions of adolescents and families when deciding which college to attend. As O’Neil states, these rankings have quickly transformed into a national standard (O’Neil 84). In addition, O’Neil discusses the “self-reinforcing” nature of the rankings and the “vicious feedback loop” (O’Neil 83) generated by them: poorer rankings would lead high-achieving students and professors to avoid the school and disgruntled alumni would reduce their contributions , further lowering the ranking. Administrators of colleges and universities thus have a major incentive to try to improve their rankings in any way they can: a higher ranking will attract more - and better - students to their institution, which will continue to raise the ranking. Many aspects of a student’s college experience that contribute to their professional success and happiness are intangible and unquantifiable, such as their learning, positive relationships developed, and confidence, which forces US News to utilize proxies in their algorithm that correlate with students’ professional success to determine the rankings of colleges. One of these proxies, as listed by US News, concerns faculty resources of a college for a given academic year. This proxy is allocated a weightage of 20% in US News’ algorithms for their ranking of national universities as well as their ranking of national liberal arts colleges, and the factors that fall under this proxy are class size index, faculty compensation, percent faculty with terminal degree in their field, percent faculty that is full time, and the student-faculty ratio (Morse & Brooks 1).
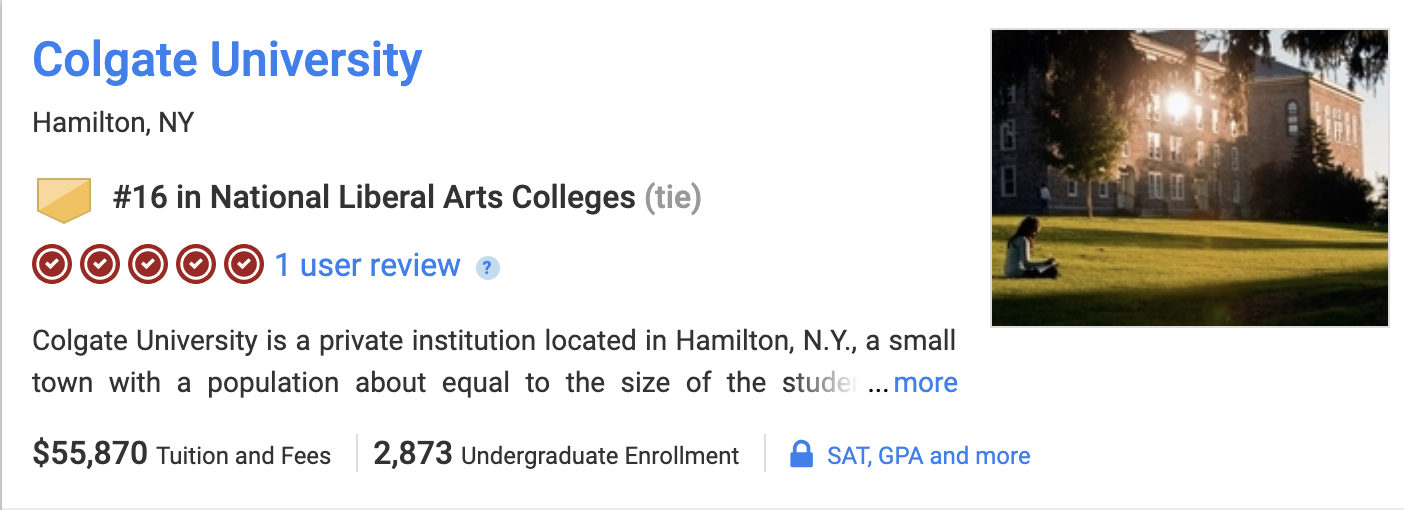
Class size index is the most dominant factor; it alone accounts for 8 percentage points out of the 20 that are associated with this proxy. Class size index has a weightage of 8% in the rankings, and is measured as follows: schools receive the greatest credit in this index for their proportions of classes with fewer than 20 students, classes with 20-29 students score second highest, 30-39 students third highest, and 40-49 students fourth highest, while classes with more than 50 students receive no credit. The data used for the class size index, however, is only collected from the fall semesters at colleges (Morse & Brooks 1). O’Neil argues that a model constructed from proxies - like the US News rankings - is easy to “game” (O’Neil 86), and writes extensively of manipulative methods employed by universities to raise their US News ranking. This project analyzes whether Colgate University is manipulating the system with regards to class size index through investigating the likelihood of classes to be overenrolled in the fall versus the spring, as the all-important data for the US News rankings are only collected in the fall. Spring enrollment numbers are not accounted for by the model. Higher likelihood of overenrollment in the spring than in the fall would demonstrate the influence of the US News rankings on Colgate University and suggest manipulation on the part of the university to keep their rankings high, or even boost them, with regards to this proxy. The analysis utilizes enrollment data from the fall and spring semesters of the 2017-2018 academic year.
The first part of our process required a massive collection of data from the Colgate course enrollment webpage. In particular, we needed to collect the actual enrollment and maximum enrollment for every class in the past six semesters in order to analyze over-enrollment patterns. We did this using a Python package for parsing HTML and XML called Beautiful Soup. Beautiful Soup allowed us to traverse through the HTML code on a “course layout” page, and click into each course description to find the actual and maximum enrollment of each class. At first, we hit two major roadblocks that deterred our course enrollment findings. Firstly, within a given course, there was inconsistent formatting of the enrollment figures. There were some course description pages, for example, that allocated a certain number of spots to each class year, and others that did not. Since these course pages often had variable formatting, we decided to capture only the numbers immediately to the right of the “Total” header. This allowed us to capture any enrollment number, as long as there existed one in the first place. Secondly, we had to modify our original plan of traversing through every Colgate course (for a given term) with no course filters because we could not figure out a way to access the distinct “course layout” pages since each of them had the same URL. Instead of using a different web scraping tool, we decided to apply a course filter and iterate through every department “course layout” page since all courses for every department were on a single page. Once we traversed through every course in each department for six semesters, we exported this data to a csv file so that we could conduct regressional analysis using it in Stata.
Once we read the csv file in Stata, we began our regressional analysis. We first renamed each of the variables (represented by columns in Stata) to more meaningful names, dropped the original variable names (v1, v2, …), deleted our accidental addition of the “header row”, and moved the one UNST class offered in the spring into the CORE department to reduce later problems with calculating over-enrollment. After these preparatory steps, we ran a linear probability model (LMP) that provided the predicted probability for each department that one of their classes is overenrolled in the spring term. To avoid heteroskedasticity from our linear probability model, or avoid non-constant variance of the error terms, in other words, we used regressions that were heteroskedasticity-robust by effectively appending a “vce(robust)” to our regression commands. Once we had this data, we calculated the individual departments' propensity to over-enroll in fall and in spring. In other words, we found the likelihood of each department to over-enroll across all of its classes regardless of whether it was fall or spring.
After calculating this regression, we realized (with some help from Professor Blume-Kohout) that including Honors Seminars and Senior research in our regression analysis would be problematic since many of these are coded to an enrollment maximum of zero. Even classes with a maximum enrollment of eight or less were ultimately dropped from our analysis since they increased our overall regression error, and there were not many of these classes to begin with, so removing them did not damage our overall findings. Finally, we calculated two regressions (and margin commands immediately after) related to our investigation of the impacts of US News & World Report’s rankings on Colgate. The first model we ran is called a Regression Discontinuity Design. It allowed us to test whether classes directly below the cutoff of 20 students have a different probability of enrolling in fall versus spring, for classes that are more similar to each other in size. It is important to note that there are a lot of classes capped at 18, and many that are capped at 25, so we decided to implement a symmetric "band" of classes between max 14 (max size for most seminar-size classrooms) and max 25. After this, we ran a margins command which evaluated how the probability of over-enrollment changes for fall versus spring and evaluates that both for classes subject to the higher-stakes "Under20" (max 19) cutoff, versus those just above the cutoff with a max class size of 20 to 25.
Our final regression allowed us to test whether courses with max enrollment below 20 are less likely to over-enroll in the fall to 20 or more students, keeping in mind that the probability of a class with an 18 student cap over-enrolling to 20 students is likely greater than the probability of a class with a 12 student cap over-enrolling to 20 students. After running our margins command, we found for each possible class max size, the difference in probability of over-enrolling with actual enrollment 20 or higher, for fall versus spring. With all of these results, we can clearly see a tendency of Colgate classes under the 20 student cap over-enrolling in the spring in order to game the US News & World Report’s Rankings (discussed in Analysis). In the future, it may be beneficial to evaluate a “maximum enrollment threshold” at which we should drop all figures below a given certain maximum enrollment such that we have more data to work with, but the low maximum enrollment classes will not hinder our regressions. Overall, there were many possible adjustments to the data we could make in the future to create a more precise model, such as taking into account departments that offer more courses in either spring or fall.
For our analysis, we have included our three most significant findings, among many other regressions performed in Stata (described above). An important thing to note is that while many of the regressions we performed compared fall to the spring, we reversed some of our tables to compared spring to the fall, as a way to better display the information without dealing with negative percentage points. We found that while most departments were not significantly more likely to over-enroll in the Spring compared to the fall, there were 11 departments that stood out as statistically significant in their likelihood of over-enrolling in the spring compared to the fall. These 11 departments, with their percentage point probabilities, are shown in Figure 1 (below): Core, Computer Science, Economics, Educational Studies, Environmental Economics, Environmental Geology, Environmental Studies, Film and Media Studies, Geology, Music, and Physics.
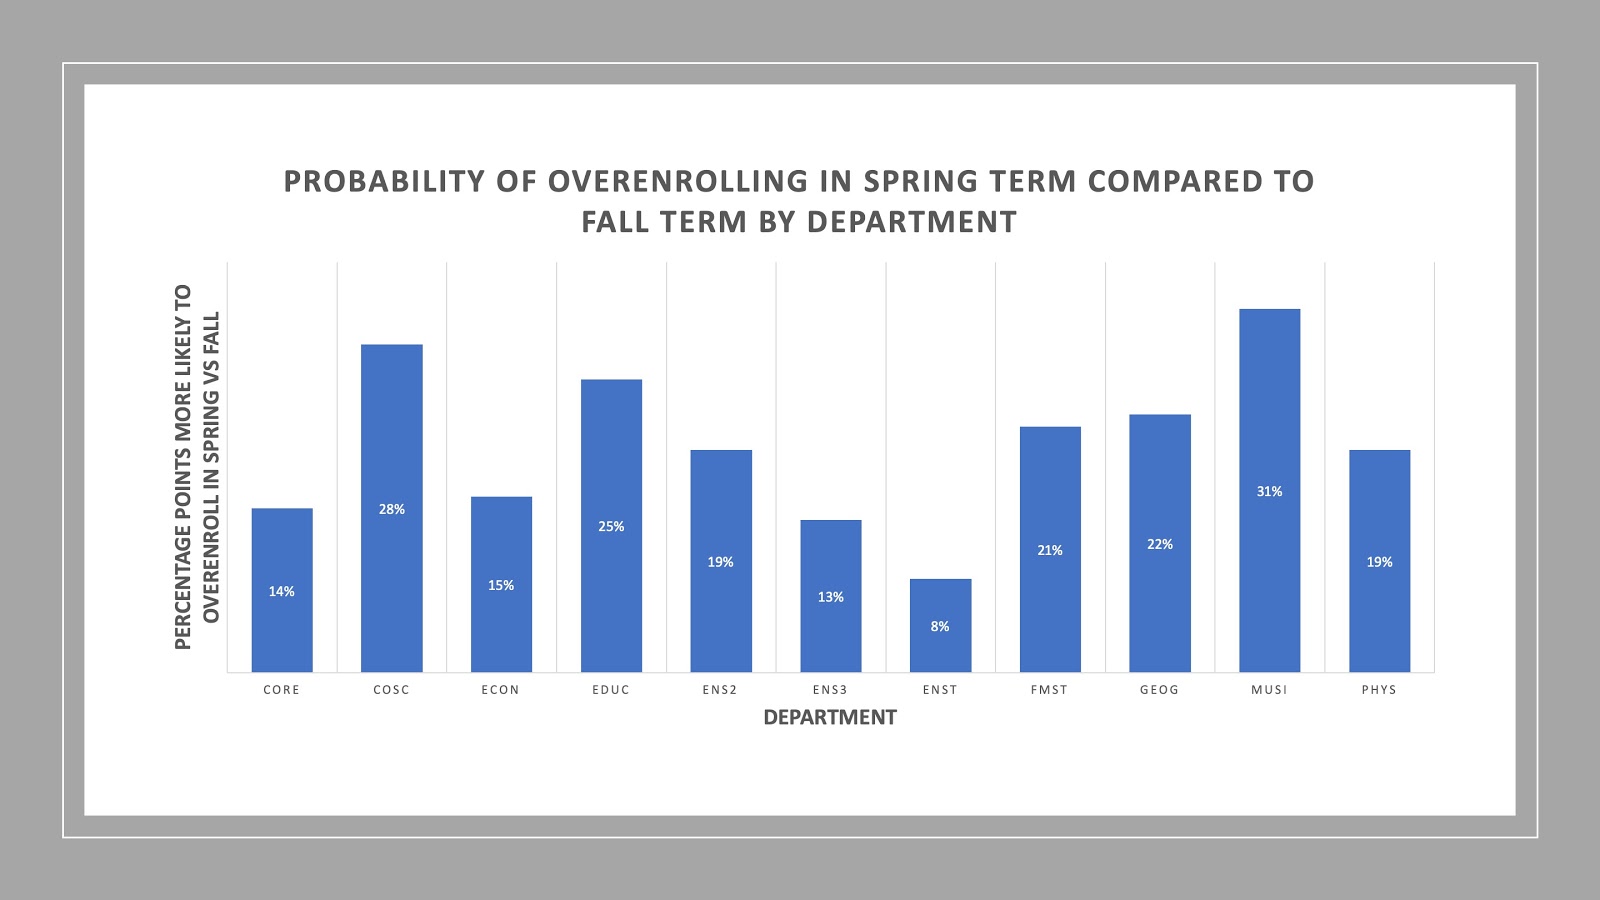
Figure 1 (above)
Our second significant finding came from calculating the probability of over-enrollment changes in the fall versus spring for classes under the 20 student cutoff, compared to those just above the cutoff with a maximum class size of 20 to 25. Here, we saw a larger negative coefficient for classes where the original max class size was between 14 and 19. The table below (Figure 2) shows that classes with a maximum size of 14-19 are around 8.7% more likely to over-enroll in the spring than in the fall and classes with a maximum size of 20-25 are around 5.4% more likely to over-enroll in the spring than in the fall. Since all p-values in this regression were below 0.02, we can conclude that this data was statistically significant.
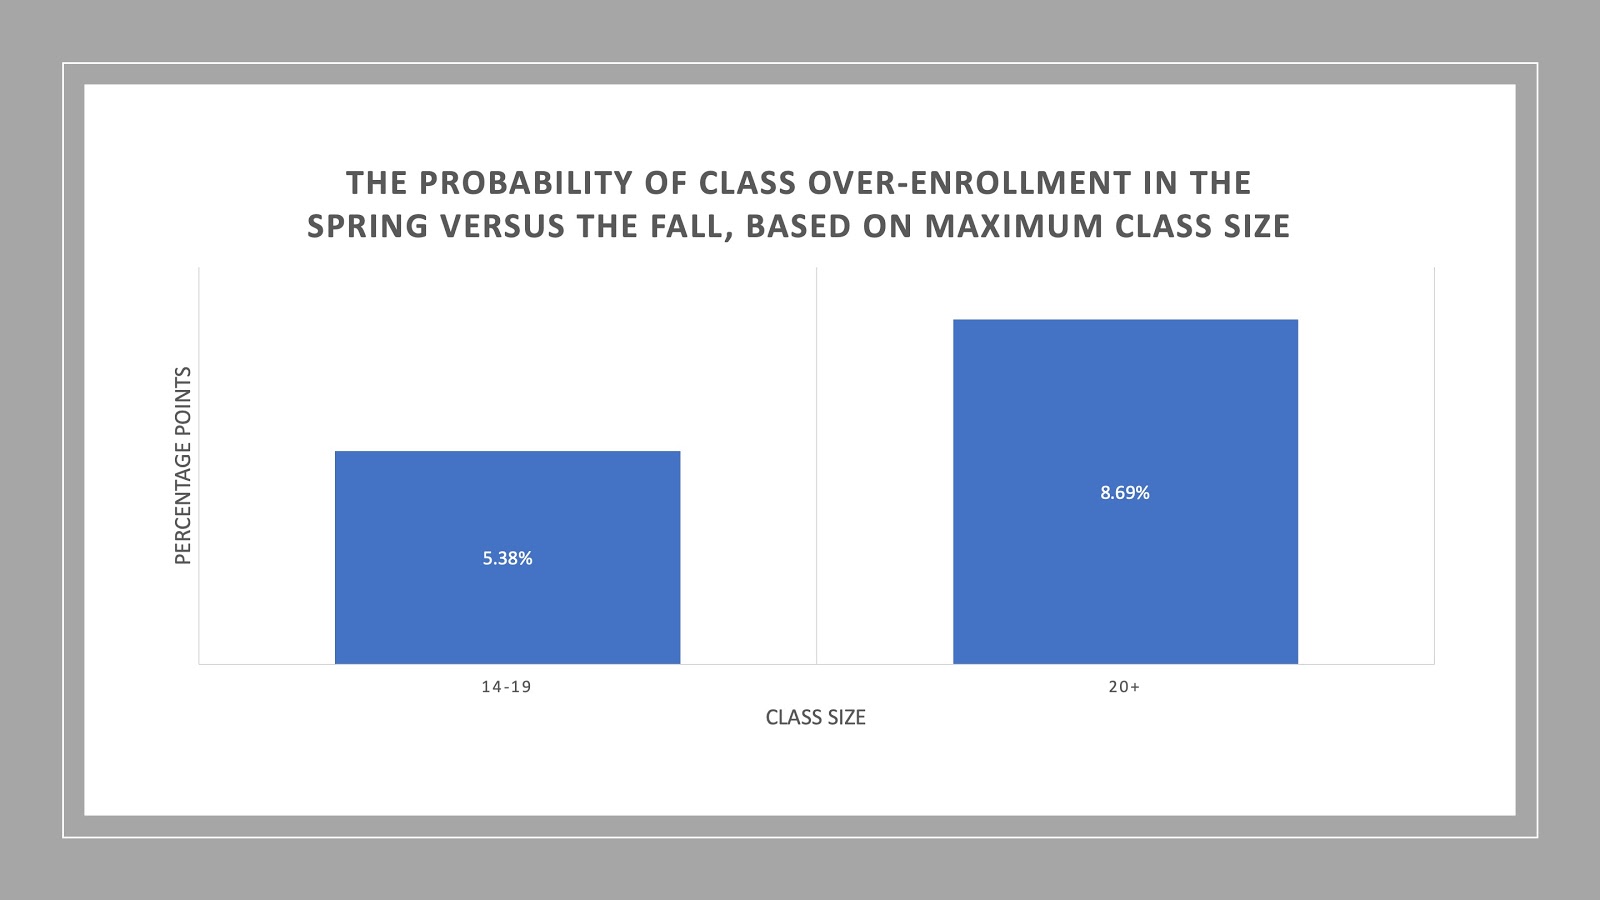
Figure 2 (above)
Lastly, our third significant finding was found when calculating the difference in probability of over-enrolling with actual enrollment 20 or higher for each possible class max size (14-19), for fall versus spring. The table below (Figure 3) shows that a class with a cap of 17 students in the fall is 23.24% more likely to over-enroll to an actual enrollment of 20 or higher than in the spring, and that a class with a cap of 19 students in the fall is 6.24% more likely to over-enroll to an actual enrollment of 20 or higher than in the spring. It may seem odd that these two class maximums are the only two we included, but all others did not meet our standard of a p-value above 0.02 and were thus not statistically significant.
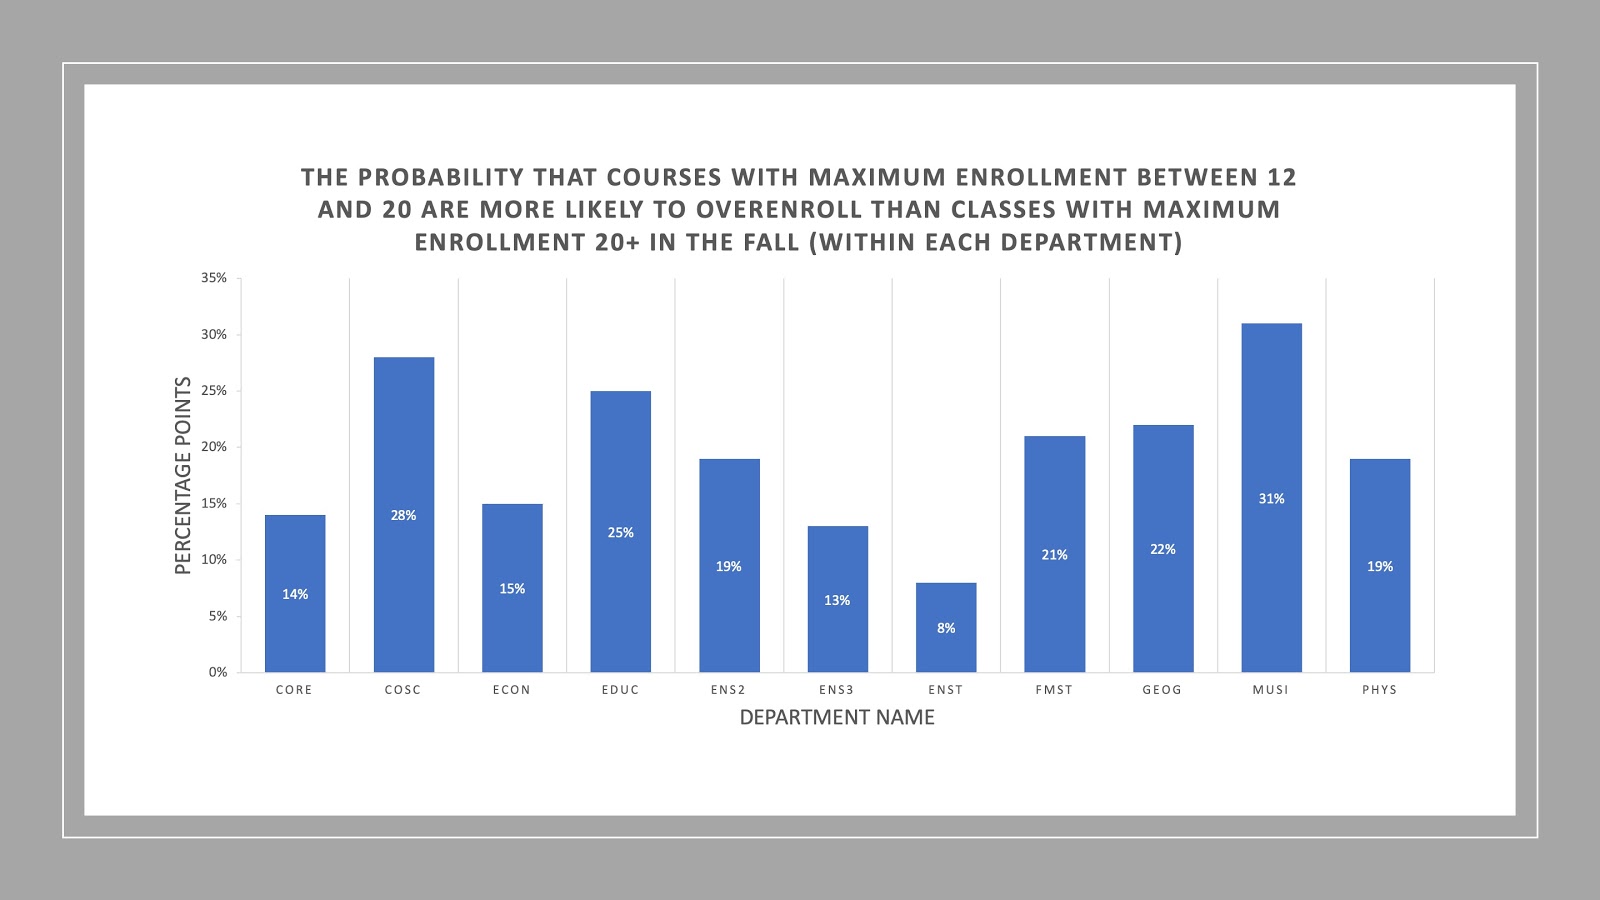
Figure 3 (above)
Ultimately, most of our regressional analyses were inconclusive and did not strictly support the notion that Colgate University is influenced by the US News ranking system, but we did find that there was an undeniable tendency that spring classes below the cap of 20 students did over-enroll to actual enrollments of 20 or higher in the spring than in the fall. As discussed in Stata results section, there are many ways to improve the accuracy of our findings in the future, whether that means using a different p value threshold, running other regressions, or even diversifying the models we use. Thus, we cannot conclude that Colgate, in general, is stricter in enforcing cap limits for courses in the fall to boost their ranking on the US News & World Report’s Rankings. However, we did find some data that substantially supports the idea that certain departments have a significantly higher likelihood of overenrolling in the spring versus the fall, like the computer science department and that there may be a tendency for spring courses to be more laid-back when it comes to over-enrollment of classes. Thus, O’Neil’s hypothesis cannot entirely be dismissed, and we hope someone can take this research up in the future and continue this analysis.
I would like to include a special thanks to Professor Blume-Kohout for guiding me through some parts of the Stata regression interpretation, and always being there to answer any questions with incredibly thoughtful feedback. This project would not have been possible without her. I would also like to thank Alex W. and Rhea T. for helping with various parts of the project.