





A Python package with a Charité-styled Matplotlib theme, visual identity colour palettes, and an Altair theme — ported from the charite R package.
pip install charite-plot                   # Matplotlib only
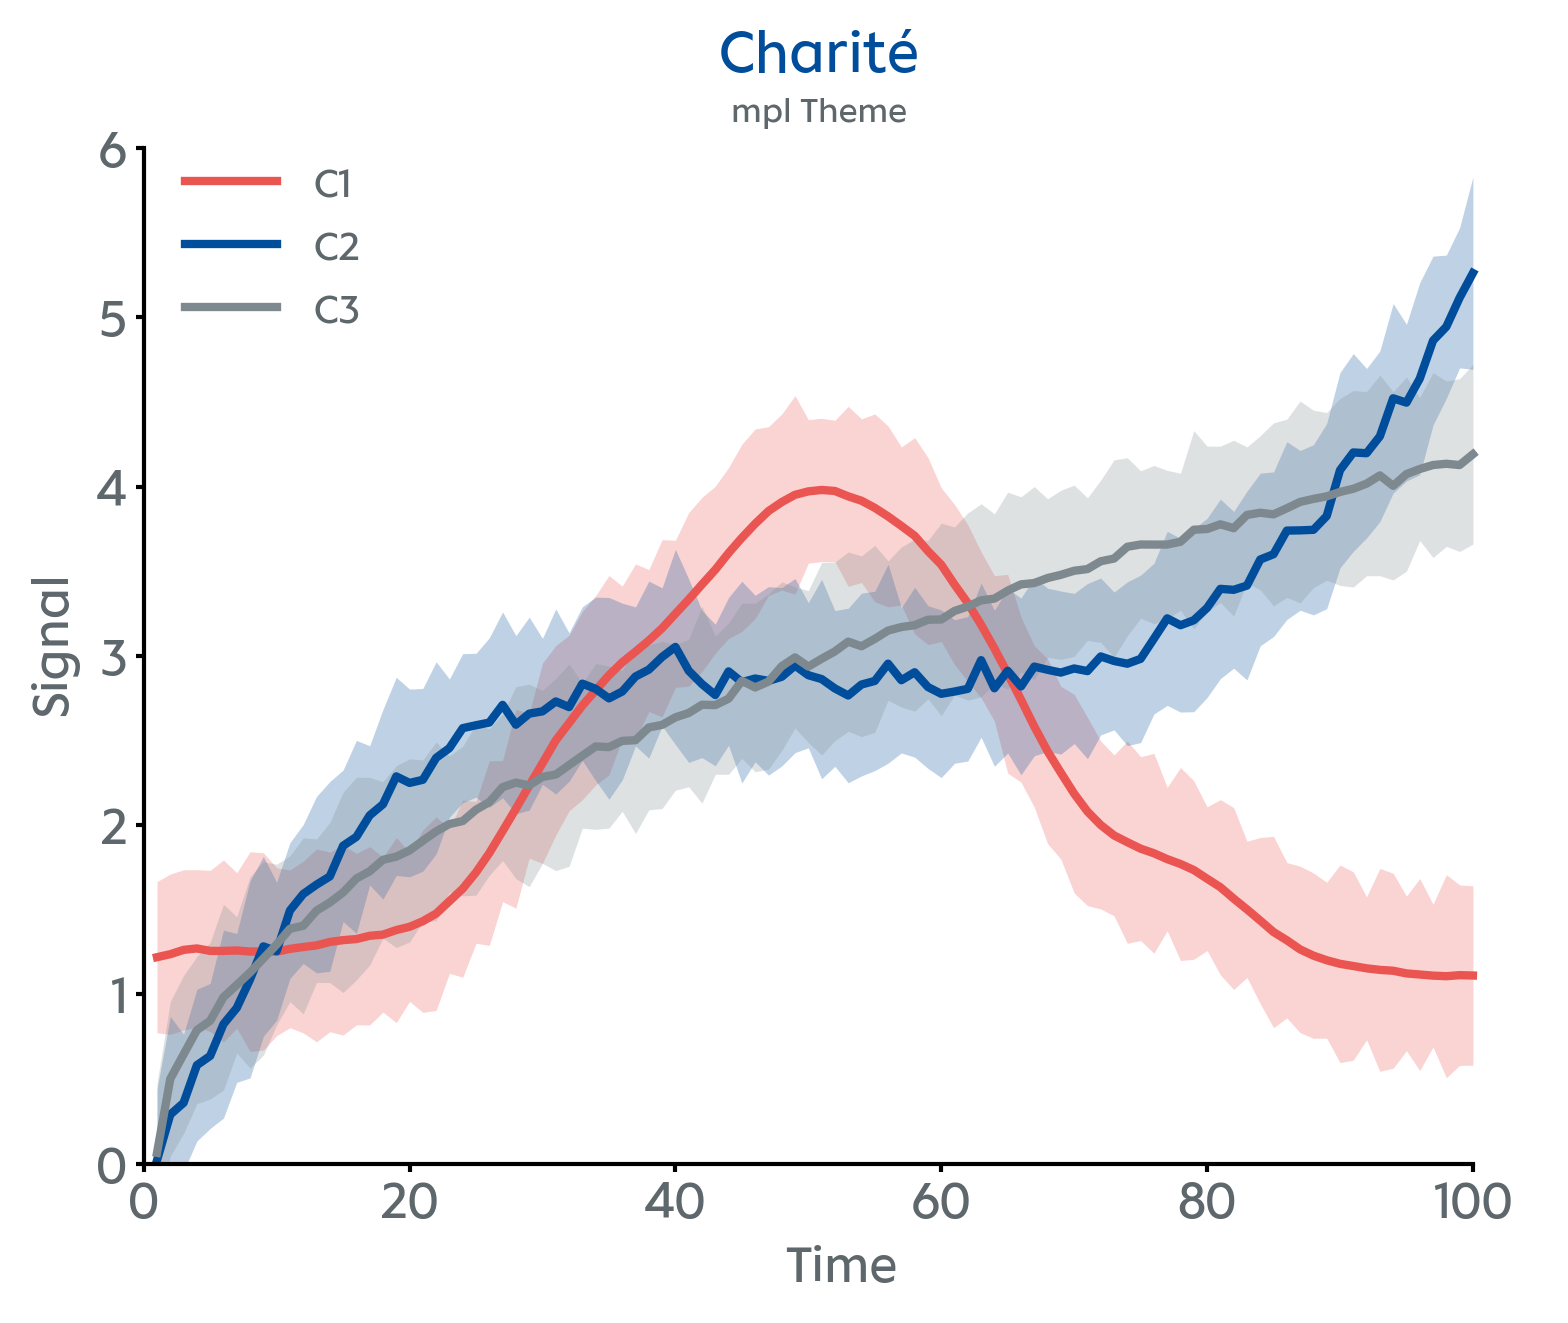
pip install "charite-plot[altair]" # with Altair supportVisualize your data with theme_charite() to match the Charité corporate style.
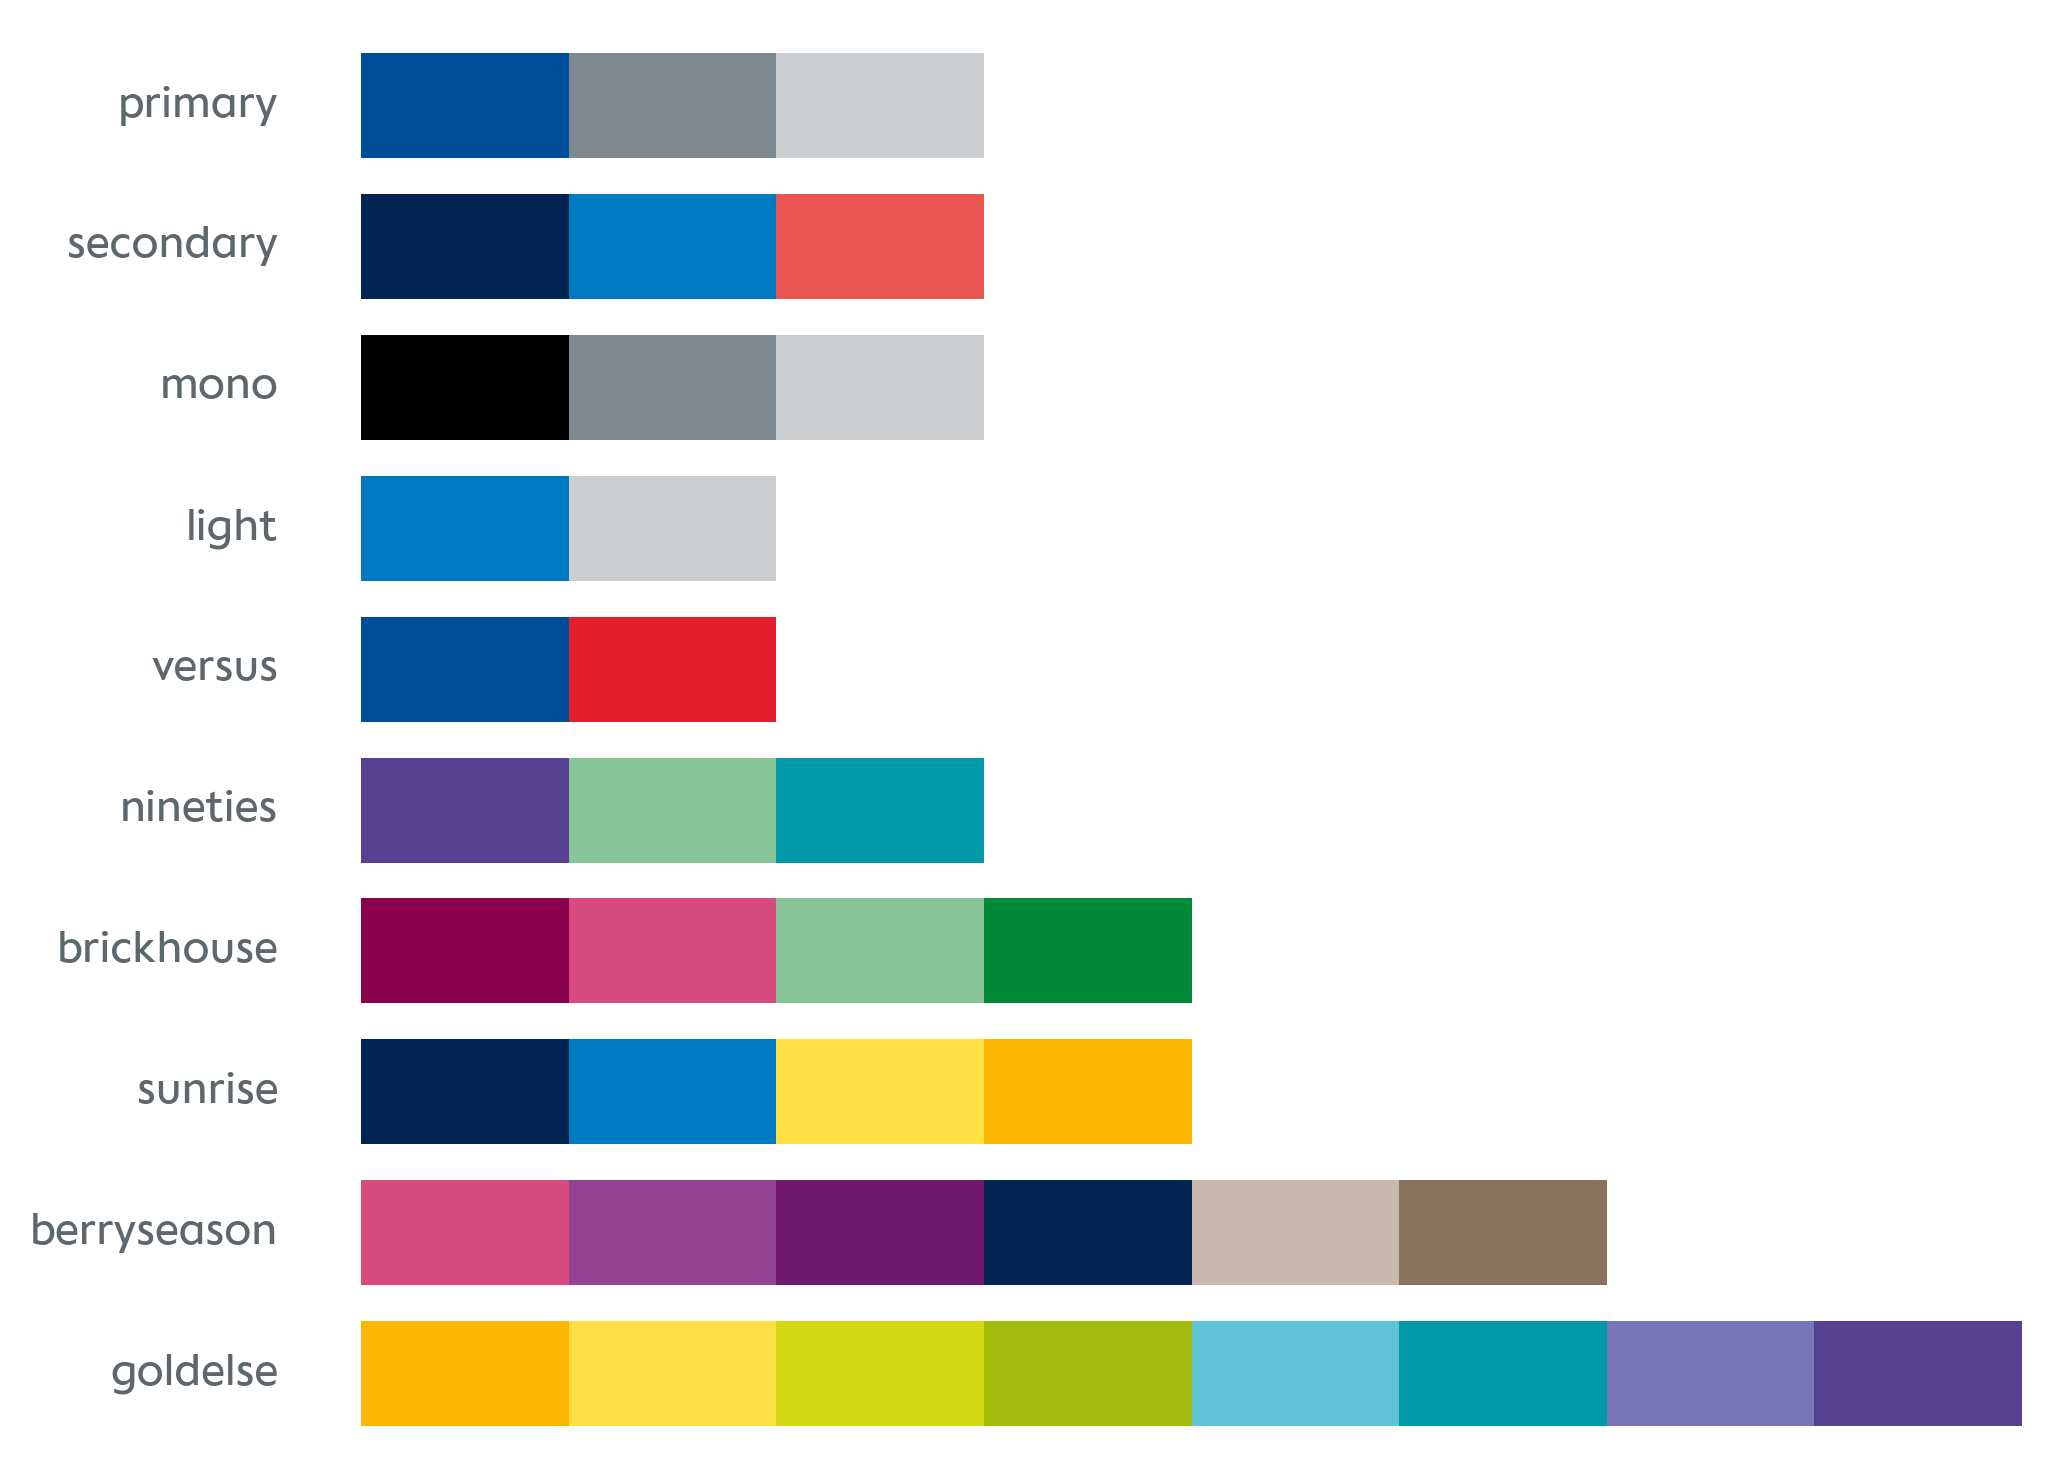
Preview the available colour palettes.
import matplotlib.pyplot as plt
from charite_plot.mpl_themes import enable

enable()

fig, ax = plt.subplots()
ax.plot([1, 2, 3], [4, 7, 3])
ax.set_title("My chart")
plt.show()
Use as a context manager to scope the theme to a single figure:
from charite_plot.mpl_themes import using

with using(palette="goldelse"):
    fig, ax = plt.subplots()
ax.bar(["A", "B", "C"], [3, 7, 5])from charite_plot.altair_themes import enable
import altair as alt
enable()
chart = alt.Chart(df).mark_bar().encode(...)Customise with keyword arguments:
enable(palette="berryseason", font_size=13)| Symbol | Description |
|---|---|
mpl_themes.theme_charite(**kwargs) |
Returns a matplotlib rcParams dict for the Charité theme |
mpl_themes.enable(**kwargs) |
Applies the theme permanently to rcParams |
mpl_themes.using(**kwargs) |
Context manager: applies the theme temporarily |
altair_themes.theme_charite(**kwargs) |
Returns a Vega-Lite config dict for the Charité theme |
altair_themes.enable(**kwargs) |
Registers and enables the theme in Altair |
altair_themes.using(**kwargs) |
Context manager: enables the theme temporarily |
altair_themes.register() |
Registers the theme without enabling it (Altair-only) |
PALETTES |
Dict of 10 named colour palettes |
make_palette(name, n, reverse) |
Subsample or interpolate any palette |
CHARITE_COLORS |
Dict of all 27 hex colour constants |
The fallback chain follows the official Charité brand guidelines:
Charité Text Office → Charit? Text Office → Calibri → DejaVu Sans → sans-serif
DejaVu Sans ships with Matplotlib and is always available as the penultimate fallback; sans-serif lets the browser or system choose if nothing else matches (important for Altair/Vega-Lite). To override the preferred font:
enable(font="Arial")If you use charite-plot in your work, please cite it as:
@software{ramezani2026chariteplot,
  author    = {Ramezani, Pedram},
  title     = {charite-plot: Matplotlib and Altair Themes for Charité – Universitätsmedizin Berlin},
  year      = {2026},
  version   = {0.3.0},
  url       = {https://github.com/pedramezani/charite-plot},
  license   = {MIT},
}This package is based on the original charite R package developed by Johannes Julius Mohn.
MIT © 2026 Pedram Ramezani
The original charite R package by Johannes Julius Mohn is likewise MIT licensed.